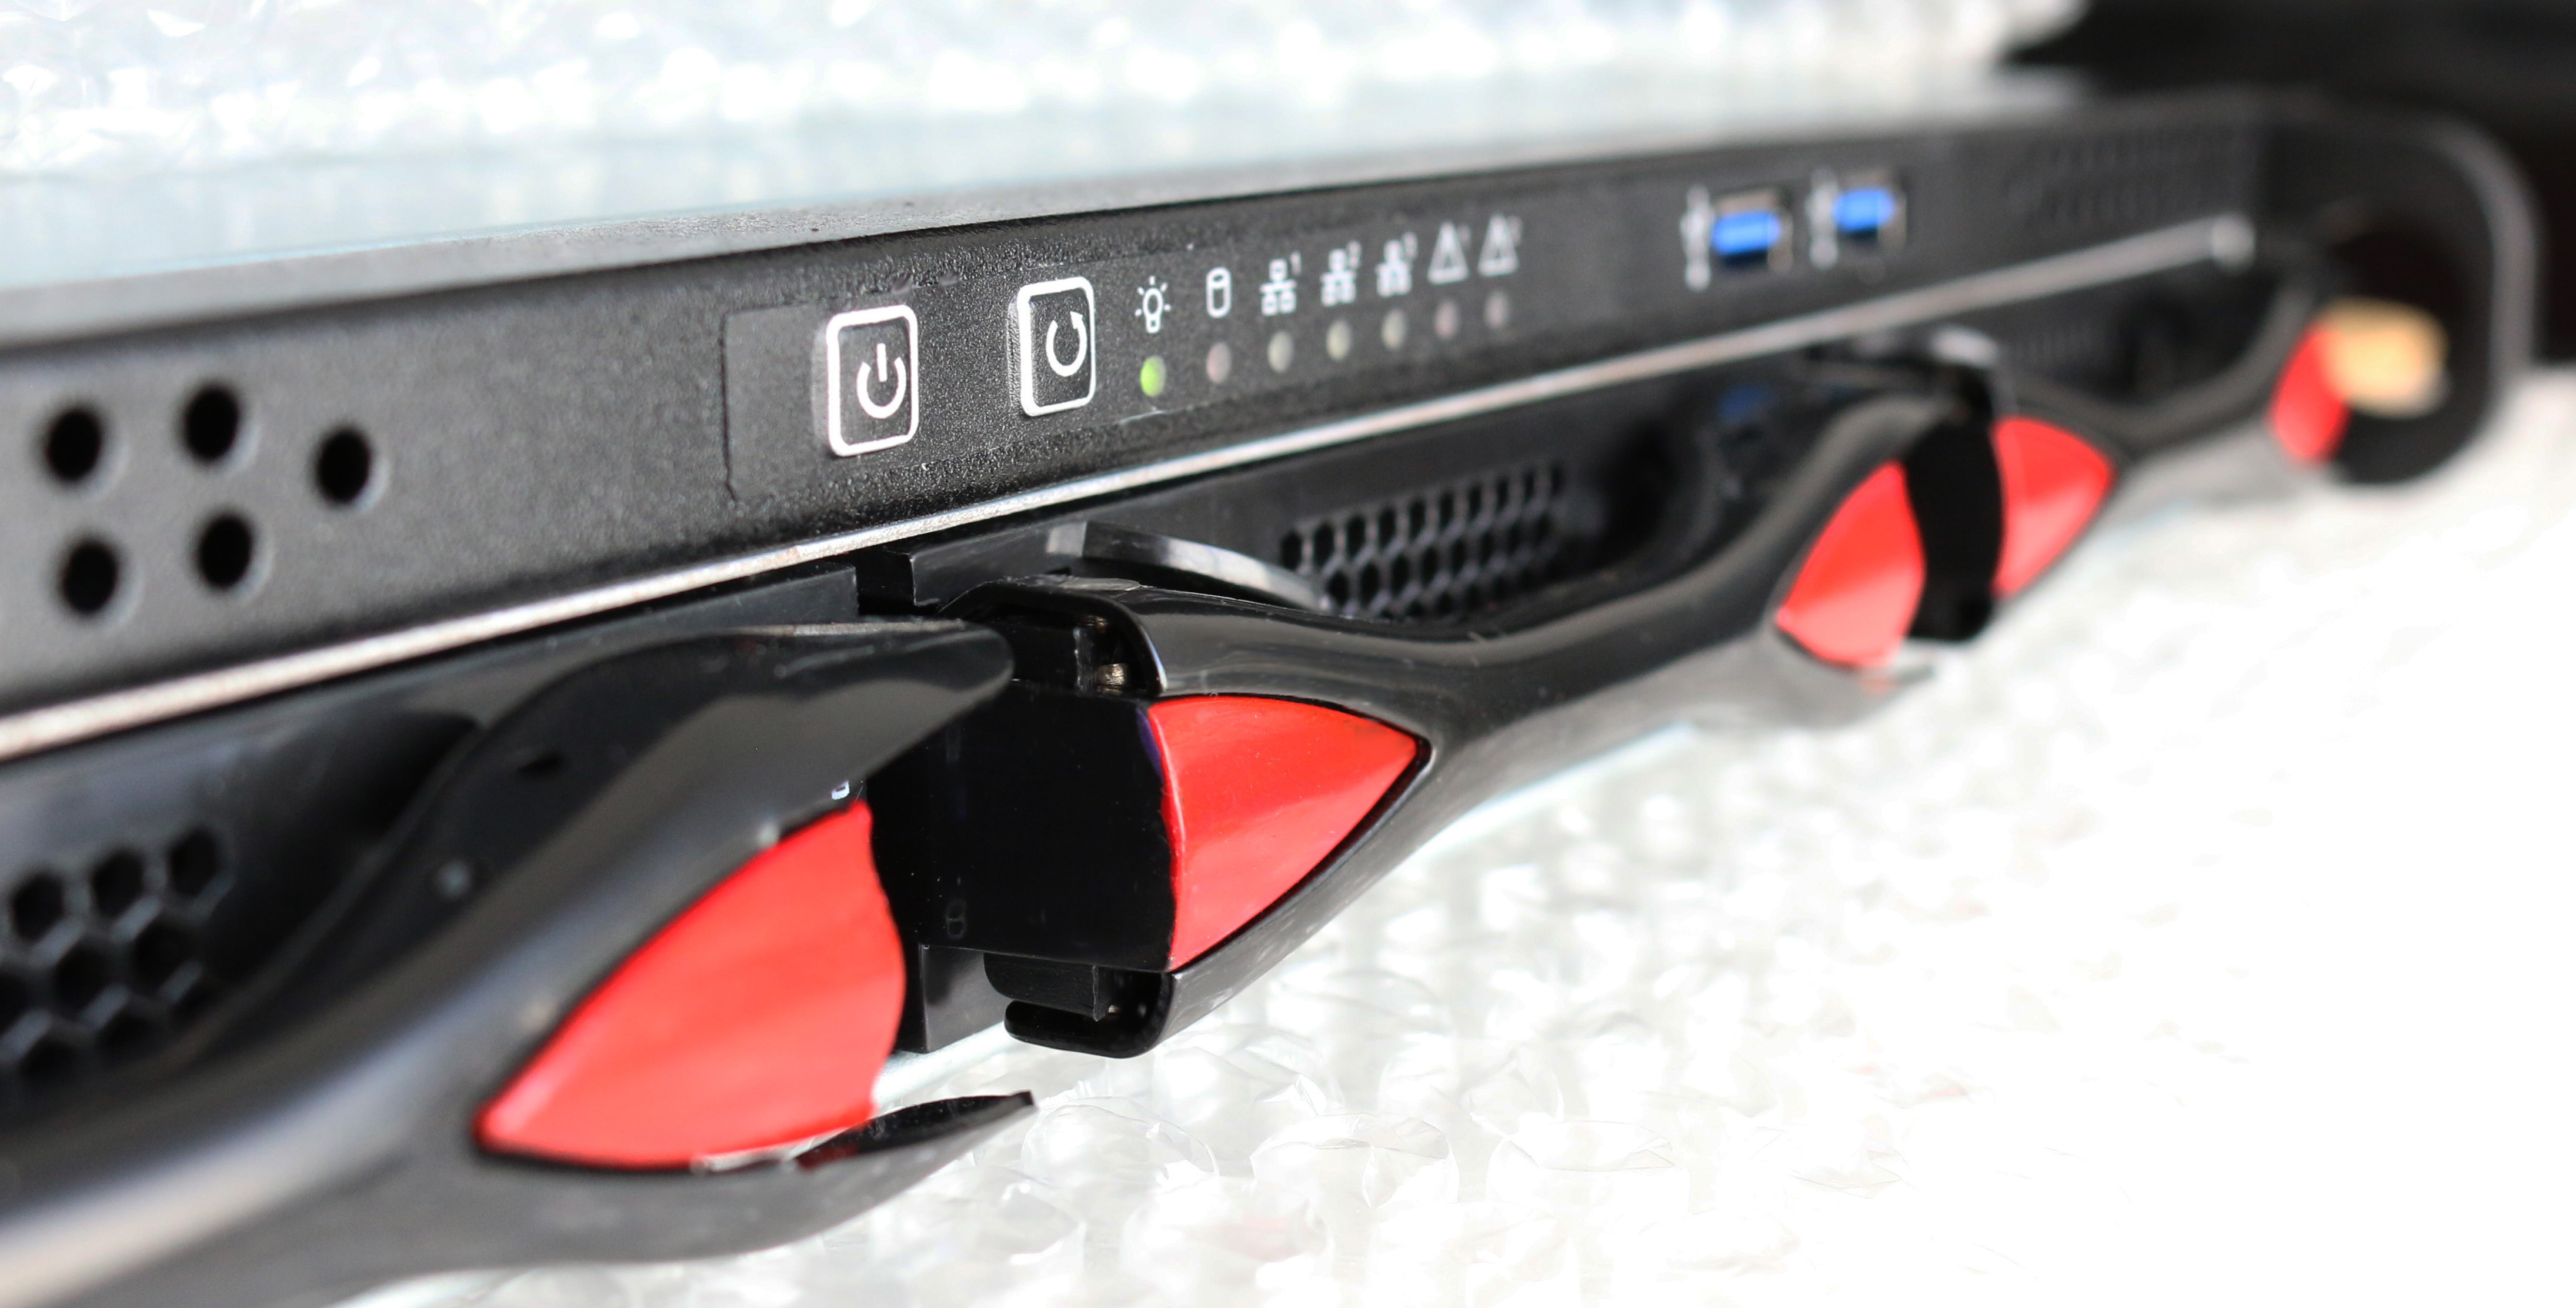
fmadio User`s Manual
Operating manual and Quick Start guide for operation of the fmadio 10Gbit/20Gbit/40Gbit/100Gbit Ethernet Packet capture appliance.
Contents
Overview
Configuration
- Network Configuration Web
- Network Configuration CLI
- Caputre Port Link Speed
- Firmware Update
- Firmware Update CLI
- Change Hostname
- RAID5 configuration
- RAID0 configuration
- iSCSI configuration
- NAGIOS configuration
- Clock Synchronization
- SSH Configuration
- Configuration Save/Restore
- Configuration ReadOnly
- Configuration Push
- Inline Packet Capture
- Flush to Disk
- NFS Mounts
- Users/Password reset
- LDAP Authentication
- Capture Interface MAC/IP
- Email System Alerts
- Disk Encryption
- Packet Privacy
- Scheduled Reboot
- Remote SYSLOG
- LACP Interface Bonding
Capture
- Capture Start/Stop: Web
- Capture Start/Stop: CLI
- Capture Scheduled
- Capture 24/7 Always On
- Capture Pre Filter
- Download PCAP: Web
- Download PCAP: CLI
- Upload PCAP: CLI
Replay
Packet Analysis
Containers
Analytics
Troubleshooting
- System Log Generation
- IPMI Port Access
- IPMI Serial Port Login
- IPMI Power Cycle
- IPMI Power Off
- IPMI Power On
API
- Capture Start
- Capture Stop
- Capture Status
- List Captures
- Split Captures by Size
- Split Captures by Time
- Single PCAP Download
- Single PCAP Download with Compression
- Download PCAP with Time Range
- Download PCAP with BPF Filter
- Download PCAP with BPF Filter and Time Range
- Download PCAP with RegExFilter
- Download PCAP Timeonly no capture name
- System Device Status
System Architecture
FMADIO10
The FMADIO10 packet capture device is our entry level full sustained line rate 10Gbit capture to cache packet capture / packet sniffer devices. It is a compact 1U 650mm deep chassis featuring 7.4 nanosecond resolution hardware packet time stamps and sub 100ns world time accuracy via PTPv2 or GPS. In addition there is 1TB of high bandwidth SSD flash storage which is written back into 16TB of raw magnetic disk drives. The system is unique by combining a hybrid SSD / HDD storage architecture to gain maximum cost savings with maximum disk storage and still be capable of sustained 1TB worth of line rate capture without any packet drops.

Features:
- Sustained 10Gbit line rate capture to 1TB Cache
- Compact 1U form factor
- Hardware Packet Time Stamping
- Sub 100ns accurate World time synchronization
- PTPv2 Time Synchronization
- PTPv2+PPS Time Synchronization
- GPS+PPS Time Synchronization
- 16TB of Raw hot swap Disk storage
- 1TB of high speed SSD cache
- x1 10G SFP+ Capture Port
- x1 10G SFP+ Management Port
- x1 1G RJ45 Management Port
FMADIO20
For full 10Gbps duplex line rate capture FMADIO20 packet capture device provides sustained line rate 20Gbit capture using 2x10G SFP+ 10Gbe ports. Housed in a compact 1U 650mm deep chassis featuring 7.4 nanosecond resolution hardware packet time stamps and sub 100ns world time accuracy via PTPv2 or GPS. This 20Gbe packet capture device has 2TB of high bandwidth SSD flash storage with over 20Gbps+ of sustained IO throughput. This 2TB of cache is written back into 16TB of raw magnetic disk storage. This system is ideal for medium utilization full duplex 20Gbps packet capture.

Features:
- Sustained 20Gbit line rate capture to 2TB of Cache
- Compact 1U form factor
- Hardware Packet Time Stamping
- Sub 100ns accurate World time synchronization
- PTPv2 Time Synchronization
- PTPv2+PPS Time Synchronization
- GPS+PPS Time Synchronization
- 16TB of Raw hot swap Disk storage
- 1TB of high speed SSD cache
- x2 10G SFP+ Capture Port
- x1 10G SFP+ Management Port
- x1 1G RJ45 Management Port
Whats in the box
FMADIO10/FMADIO20
System includes the following items :
- x1 1U FMADIO10 or FMADIO20 Packet sniffer system (A)
- x1 GPS PPS -> PPS In SMA Coax Cable (B)
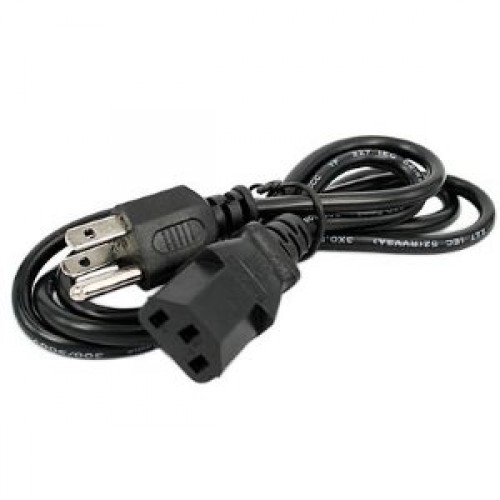
- x1 110V Japanese/American Power connector (C)
- x1 Rack mount Rail Kit (optional) (D)
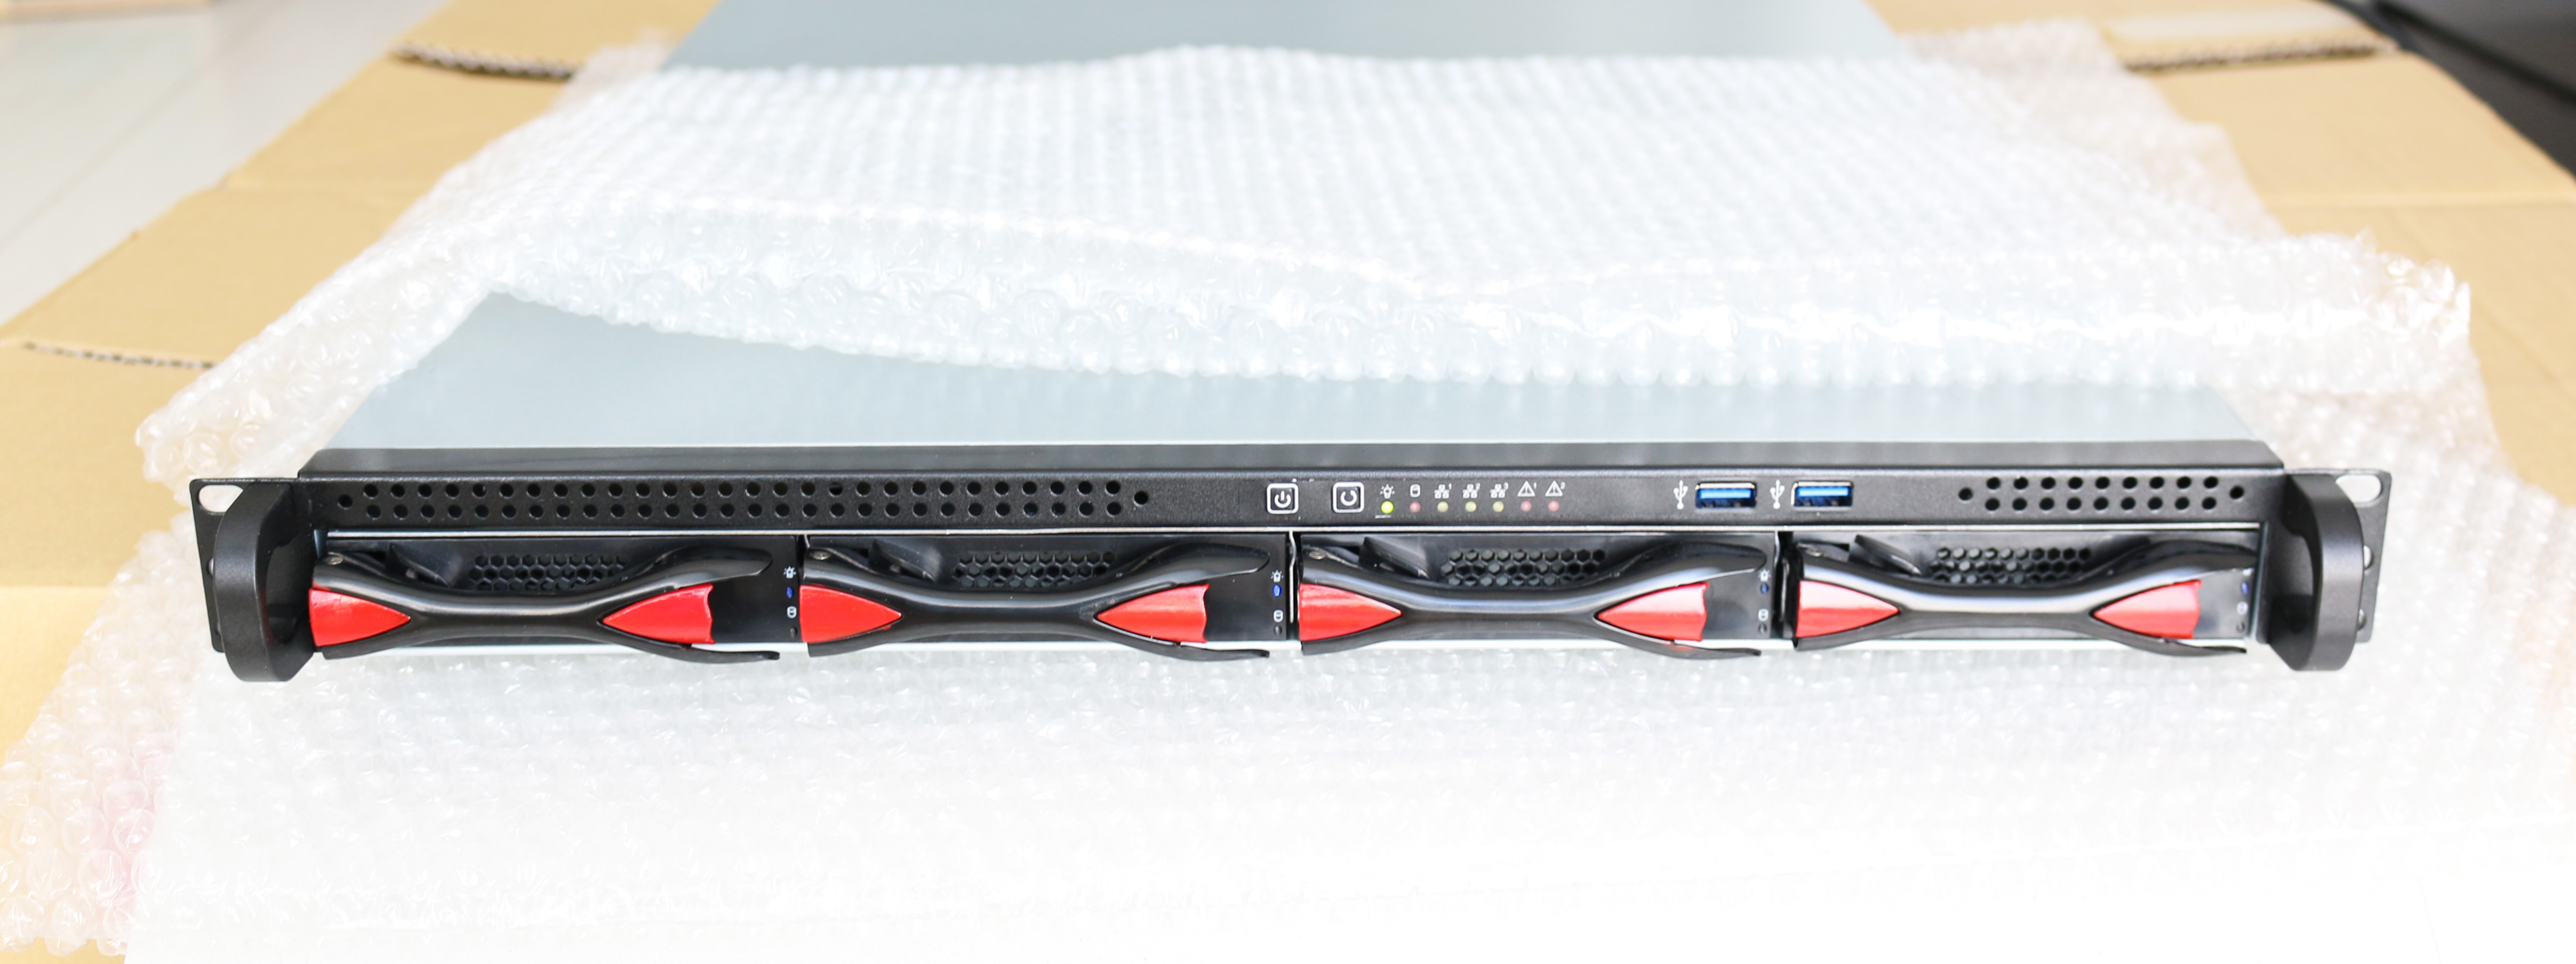
(A) 1U FMADIO10 or FMADIO20 packet sniffer device
(outside chassis is identical for both models)
(C) 110V Japanese/American Power connector
(D) Rack mount Rail Kit (Optional)

Hardware Layout
Front Ports
The hardware interfaces at the front of the chassis are as follows:

How swap 3.5" Drive
Standard Hot swap 3.5" SATA drives of the internal RAID5 array. These are populated with Toshiba 4TB SATA drives resulting in a total of 16TB of raw magnetic disk storage.
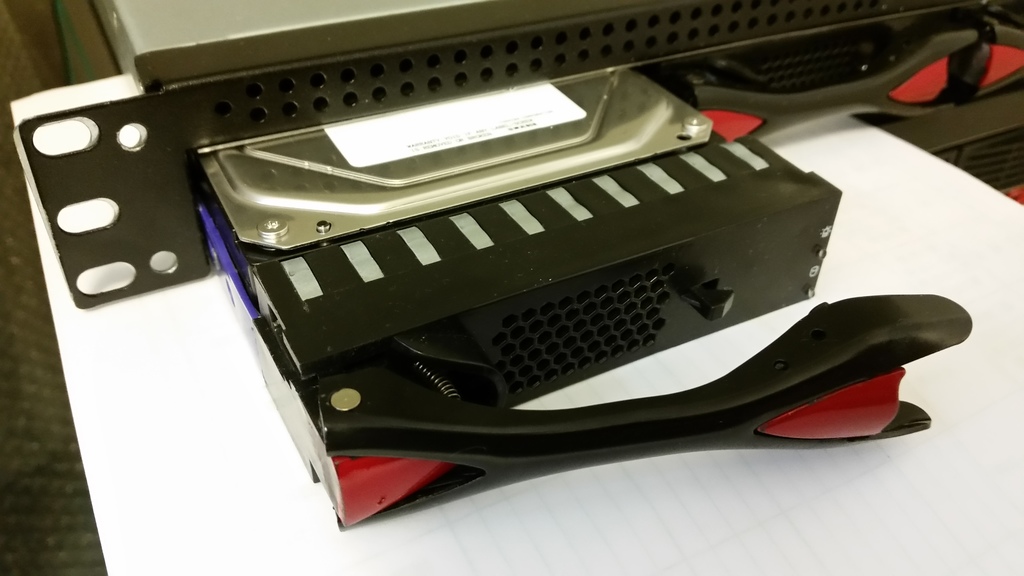 Close up of hotswap drive bay
Power Switch
Power button to turn on the device. To force a power off hold the button for 10 seconds.
Reset Switch
Hard system reset button, effective immediately.
USB 3.0 Port
Single USB 3.0 port.
Rear Ports
The hardware interfaces at the rear of the chassis are as follows:
(Note that FMADIO10 and FMADIO20 have slightly different ports)
FMADIO10

FMADIO20

Each port is described as below:
IPMI
IPMI port is a 10/100/1000M RJ45 ethernet network port used for out of band management. It provides system monitoring, serial port access and enables remote machine reboot via SSH or Web interface
1G Management
Primary RJ45 management / user interface for the device at 10M/100M/1Gbit speeds. Access is provided via HTTP/HTTPS and SSH.
10G SFP+/SFP Mgmt
High speed SFP/SFP+management / user interface running at 10Gbps. This is dual mode SFP/SFP+ port enabling both 1G SFP modules and 10G SFP+. Access is provided via HTTP/HTTP and SSH.
10G SFP+/SFP Capture
These are the 10Gbit capture interface. It is also dual mode SFP/SFP+ interface enabling 1G and 10G capture based on the clients requirements. FMADIO10 has 1 capture interface, while FMADIO20 has 2 capture interfaces.
PPS Out
Extreme accuracy (10ns <) 1PPS (one pulse per second) signal. It runs off a highly accurate TXCO (Temperature controlled crystal) enabling external devices to synchronize to FMADIO10/20 highly accurate world time. This is a 5V CMOS PPS signal, the rising edge indicating start of a second and is active for 8ms. Connector type is SMA female connector.
PPS In
Expects a 1PPS (one pulse per second) with the signals rising edge indicating the start of the second. Electrical characteristics are 5V into 50ohm to ground. This enables highly accurate packet time stamps, with extreme time synchronization accuracy with an external device such as Time Grandmaster. Synchronization accuracy is typically typically 10-20ns. This is a SMA female connector.
GPS PPS Out
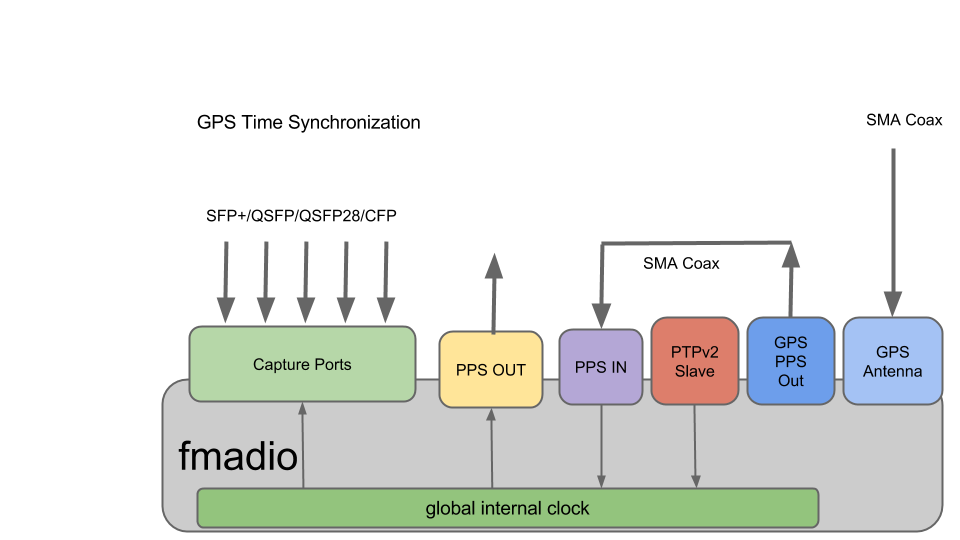
GPS (Global Position System) 1PPS (one pulse per second) provides highly accurate world time generated from a simultaneous 22 satellites in geo-synchronous orbit. This highly accurate world time can be exported to other devices or connected back into the FMADIO10/20 capture system by connecting the "PPS In" to the "GPS PPS Out" port with the included SMA connector cable. This is a SMA female connector.
GPS Antenna
GPS (Global Position System) external active antenna SMA female connector. For maximum time accuracy, the antenna requires a 180 degree view of the sky.
Network Configuration
Network port configuration can be achieved using a) the web interface, b) SSH command line interface(CLI). Using the Web interface is the easiest route, however in highly constrained network environments a pure CLI based configuration can be easier
Web Interface: Network Config
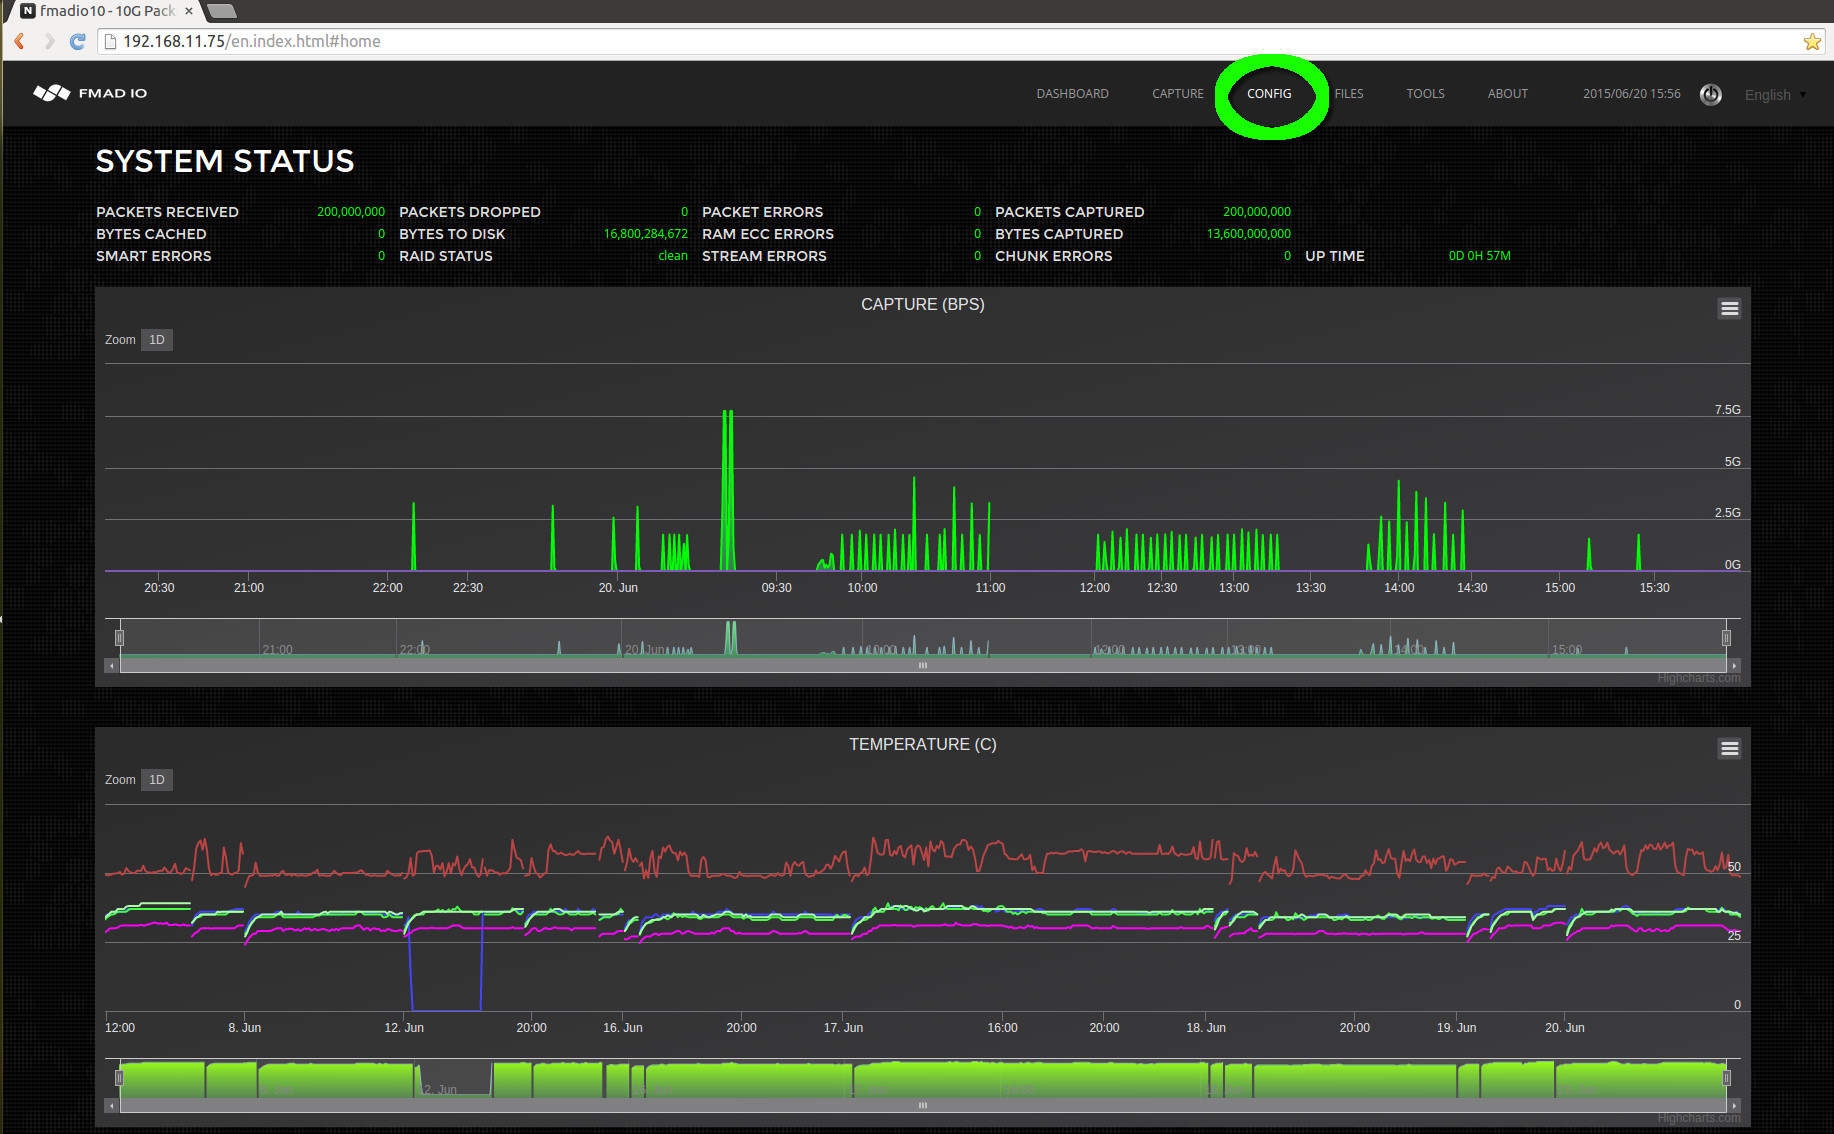
From the dashboard page, Start by selecting the configuration menu option from as shown below (highlighted in green).
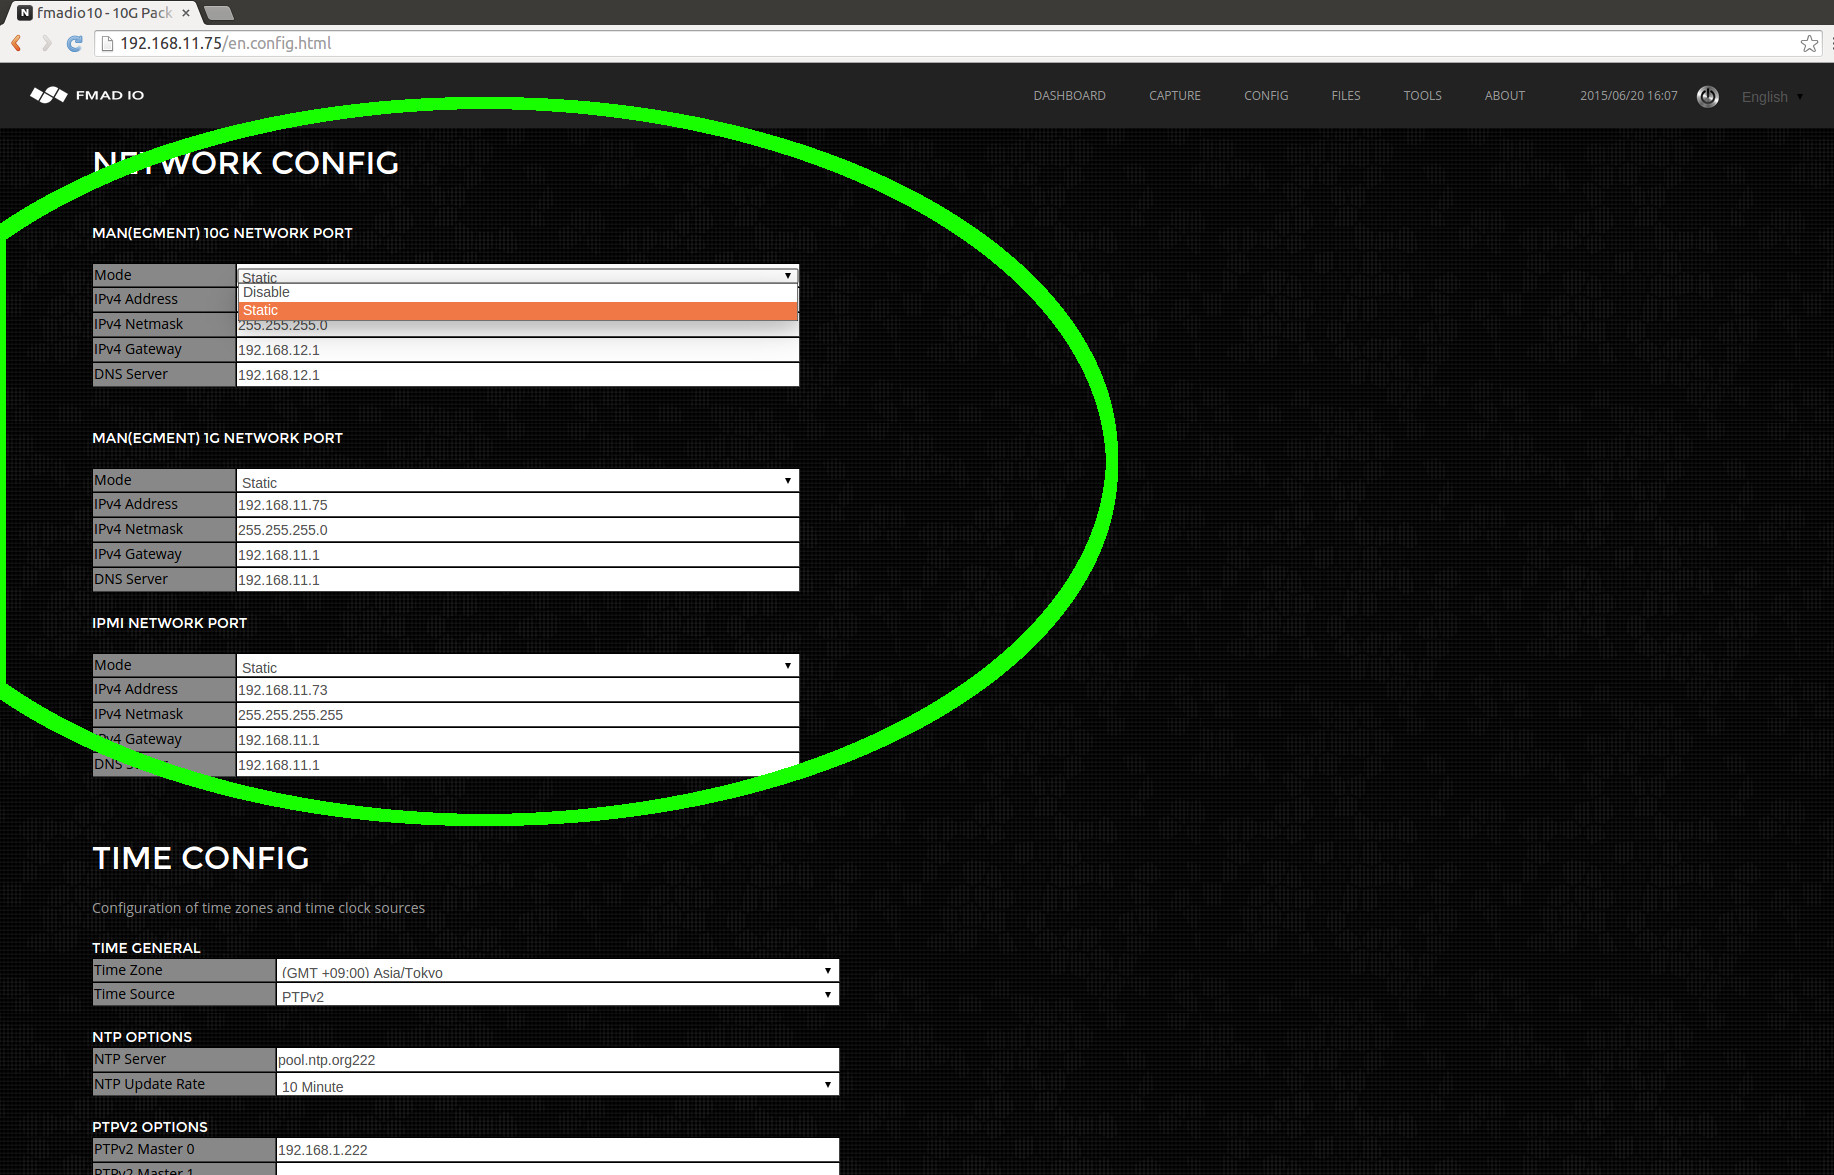
Then edit the network configuration`s IP/Netmask/Gateway/DNS setting as shown in the image below. After each field has been edited the system automatically saves and updates the system setting (save button is not required). After completing the update, refresh the web page to confirm the new settings.
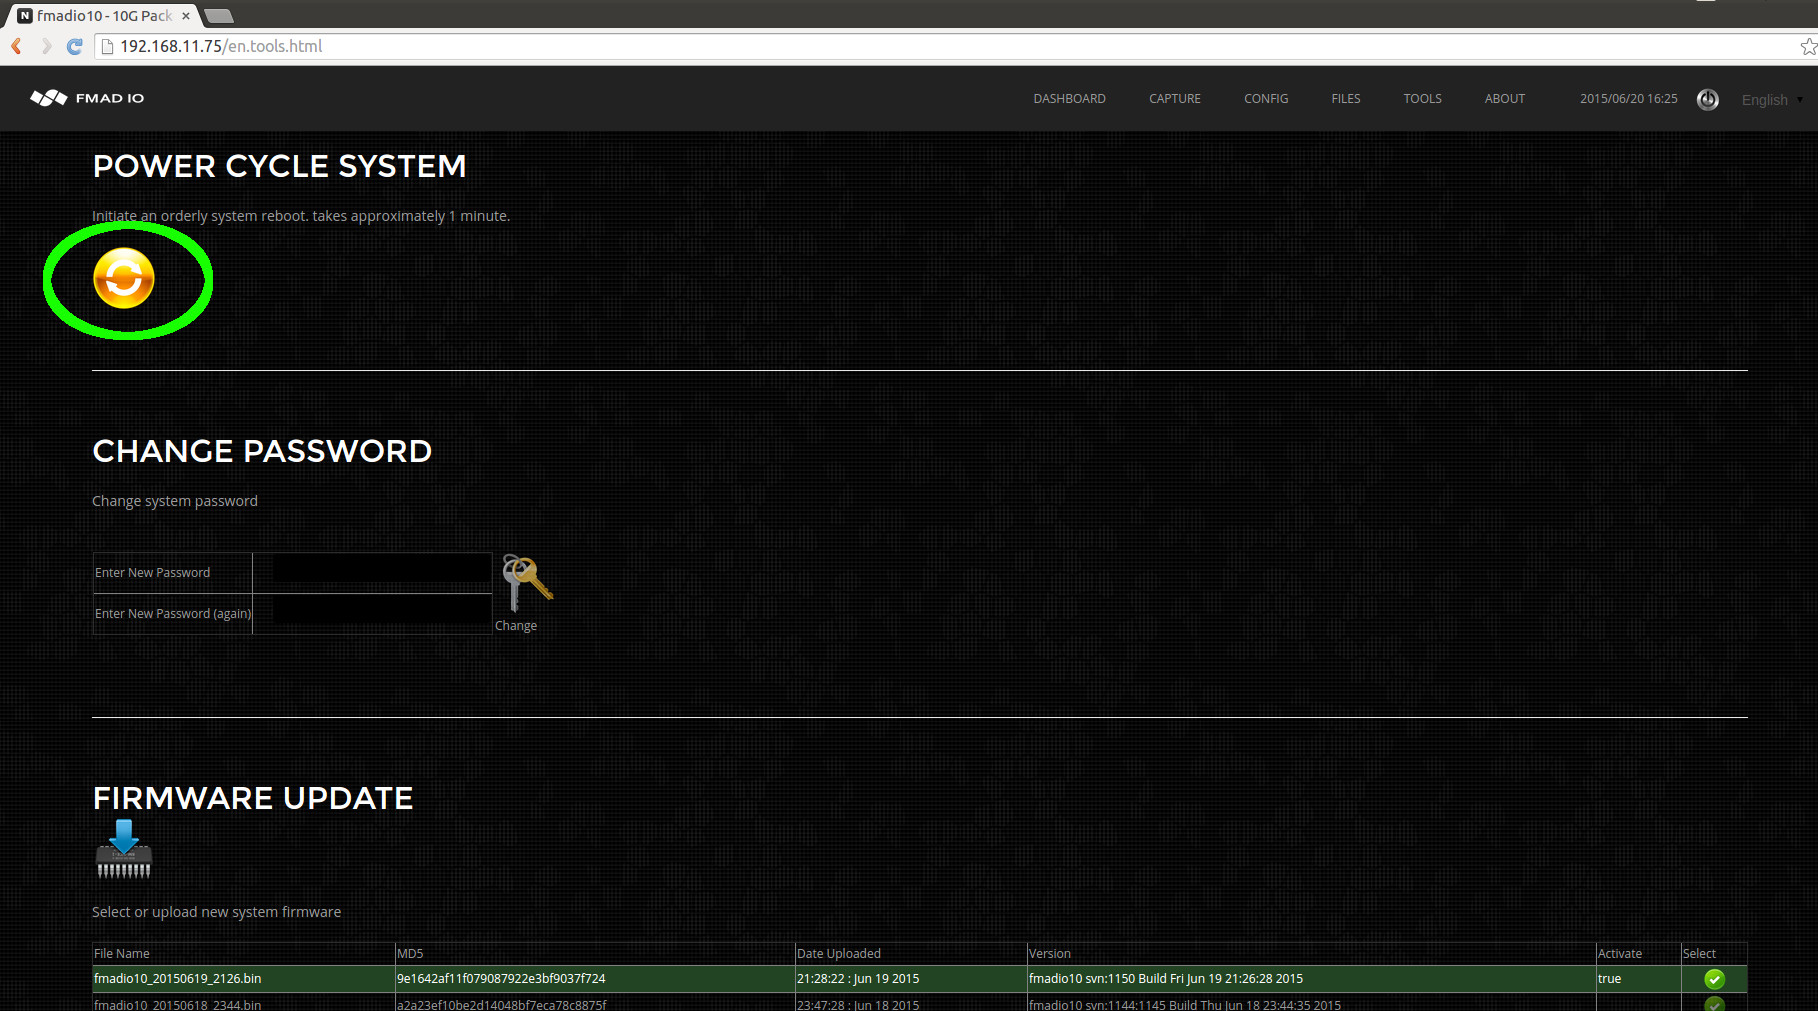
Select the tools menu from the top toolbar, as shown in the image below.

And finally select the Power Cycle / Reboot button to restart the system
CLI Interface: Network Config
Modifying the network configuration setting in a restricted Colocation environment can be far easier to achieve via the command line. The first step is SSH into the system, change to the specified directory and view the current network settings, as shown below
aaron@display0:/tmp$ ssh fmadio@192.168.11.75
fmadio@192.168.11.75's password:
  _____                    .___.__      10G
_/ ____\_____  _____     __| _/|__|  ____
\   __\/     \ \__  \   / __ | |  | /  _ \
 |  | |  Y Y  \ / __ \_/ /_/ | |  |(  <_> )
 |__| |__|_|  /(____  /\____ | |__| \____/
            \/      \/      \/
============================================
  -+ no user serviceable parts inside +-
fmadio@fmadio10-049:~$ cd /mnt/store0/etc
fmadio@fmadio10-049:/mnt/store0/etc$ cat network.lua
-- auto generated on Tue Apr 14 10:38:13 2015
local Config =
{
["sf0"] =
{
    ["Mode"]    = "disabled",
    ["Address"] = "192.168.1.2",
    ["Netmask"] = "255.255.255.0",
    ["Gateway"] = "192.168.1.1",
    ["DNS"]     = "192.168.1.1",
},
["sf1"] =
{
    ["Mode"]    = "static",
    ["Address"] = "192.168.12.10",
    ["Netmask"] = "255.255.255.0",
    ["Gateway"] = "192.168.12.1",
    ["DNS"]     = "192.168.12.1",
},
["eth0"] =
{
    ["Mode"]    = "static",
    ["Address"] = "192.168.11.75",
    ["Netmask"] = "255.255.255.0",
    ["Gateway"] = "192.168.11.1",
    ["DNS"]     = "192.168.11.1",
},
["bmc"] =
{
    ["Mode"]    = "static",
    ["Address"] = "192.168.11.73",
    ["Netmask"] = "255.255.255.255",
    ["Gateway"] = "192.168.11.1",
    ["DNS"]     = "192.168.11.1",
},
}
return Config
In the example configuration file above, the network ports are mapped as follows
FMADIO20:
sf0 -> 10G SFP/SFP+ Capture Interface
sf1 -> 10G SFP/SFP+ Management interface
eth0 -> 1G RJ45 Management interface
bmc -> 1G RJ45 IPMI Interface
In the above example we see, sf1 -> 192.168.12.10/24, eth0 -> 192.168.11.75/24, and IPMI -> 192.168.11.73
FMADIO20v4
FMADIO40v2
FMADIO100v2:
man0 -> 1G RJ45 Management Interface A
man1 -> 1G RJ45 Management Interface B
man10 -> 10G SFP+ Management Interface A
man11 -> 10G SFP+ Management Interface B
man40 -> 40G QSFP+ Management Interface A (optional depending on SKU)
man41 -> 40G QSFP+ Management Interface B (optional depending on SKU)
bmc -> 1G RJ45 IPMI Interface
This is confirmed by using the ifconfig command
fmadio@fmadio10-049:/mnt/store0/etc$ ifconfig
eth0      Link encap:Ethernet  HWaddr 00:25:90:FC:88:3C
          inet addr:192.168.11.75  Bcast:192.168.11.255  Mask:255.255.255.0
          inet6 addr: fe80::225:90ff:fefc:883c/64 Scope:Link
          UP BROADCAST RUNNING MULTICAST  MTU:1500  Metric:1
          RX packets:3779 errors:0 dropped:14 overruns:0 frame:0
          TX packets:4466 errors:0 dropped:0 overruns:0 carrier:0
          collisions:0 txqueuelen:1000
          RX bytes:756557 (738.8 KiB)  TX bytes:4443144 (4.2 MiB)
          Memory:fbb00000-fbb7ffff

lo        Link encap:Local Loopback
          inet addr:127.0.0.1  Mask:255.0.0.0
          inet6 addr: ::1/128 Scope:Host
          UP LOOPBACK RUNNING  MTU:65536  Metric:1
          RX packets:32962 errors:0 dropped:0 overruns:0 frame:0
          TX packets:32962 errors:0 dropped:0 overruns:0 carrier:0
          collisions:0 txqueuelen:0
          RX bytes:10438860 (9.9 MiB)  TX bytes:10438860 (9.9 MiB)

sf0       Link encap:Ethernet  HWaddr 00:0F:53:26:B9:10
          inet6 addr: fe80::20f:53ff:fe26:b910/64 Scope:Link
          UP BROADCAST RUNNING MULTICAST  MTU:9216  Metric:1
          RX packets:200000000 errors:0 dropped:0 overruns:0 frame:0
          TX packets:8 errors:0 dropped:0 overruns:0 carrier:0
          collisions:0 txqueuelen:1000
          RX bytes:13600000000 (12.6 GiB)  TX bytes:680 (680.0 B)
          Interrupt:26

sf1       Link encap:Ethernet  HWaddr 00:0F:53:26:B9:11
          inet addr:192.168.12.10  Bcast:192.168.12.255  Mask:255.255.255.0
          inet6 addr: fe80::20f:53ff:fe26:b911/64 Scope:Link
          UP BROADCAST RUNNING MULTICAST  MTU:9216  Metric:1
          RX packets:3976753 errors:0 dropped:0 overruns:0 frame:0
          TX packets:117267670 errors:0 dropped:0 overruns:0 carrier:0
          collisions:0 txqueuelen:1000
          RX bytes:280799142 (267.7 MiB)  TX bytes:176538287574 (164.4 GiB)
          Interrupt:44
Steps to manually change the network configuration:
- 1) Modify/edit the /mnt/store0/etc/network.lua configuration file to the appropriate setting
- 2) Run
$ sudo network_config.lua --nocal --updatebmcThis updates the internal scripts and IPMI configuration flash. - 3) Reboot the system
$ sudo reboot
Upon reboot the system will now be configured with the updated network information. Note, its best to change network settings by logging into the system by the serial port, on the IPMI interface. The following example shows how to login via the serial console.
$ ssh ADMIN@192.168.11.73
ADMIN@192.168.11.73's password:
ATEN SMASH-CLP System Management Shell, version 1.05
Copyright (c) 2008-2009 by ATEN International CO., Ltd.
All Rights Reserved
-> cd system1/sol1
/system1/sol1
-> start
/system1/sol1
press
MTU Setting
MTU Size by default is set to 1500 Bytes, but can be overriden by adding an MTU value per interface such as following line in bold
local Config =
{
["man0"] =
{
    ["Mode"]    = "static",
    ["Address"] = "192.168.1.2",
    ["Netmask"] = "255.255.255.0",
    ["Gateway"] = "192.168.1.1",
    ["DNS"]     = "192.168.1.1",
    ["MTU"]     = 9218,
}
Capture Port Link Speed
FMADIO Capture systems capture at multiple different link speeds based on the Device Model number selected, we offer all port speeds at no additional charge. The following port configurations are supported:
FMADIO100v2:
- 2x100G
- 2x40G
- 4x25G
- 8x10G
FMADIO40v2:
- 2x40G
- 8x10G
FMADIO20v2:
- 2x10G
- 2x1G/100M
Config
Configuring the different port speeds requires updating the FPGA NIC, which requires setting the Capture Port mode and then re-updating the devices firmware. The steps are shown below:
Step 1)
Select the port configuration "Config Page - > Port Config" as shown below. In this example 2x10G mode is selected.

Step 2)
After the port configuration has been selected, re-applying the firmware by clicking on the firmware update button on the "Tools" page.

It will take 2 - 10 min for the FW to be updated, the duration depends on the FMADIO Packet Capture system.
Step 3)
Once the update has completed, please verify the capture port configuration on the GUI dashboard, as shown below in blue.

Firmware Update
Firmware updates are simple and easy that enables the latest updates and system features. Please follow these steps to update the system.
Step 1) Download the latest firmware
Download the latest firmware image from the support web site.
Step 2) Select Firmware web page
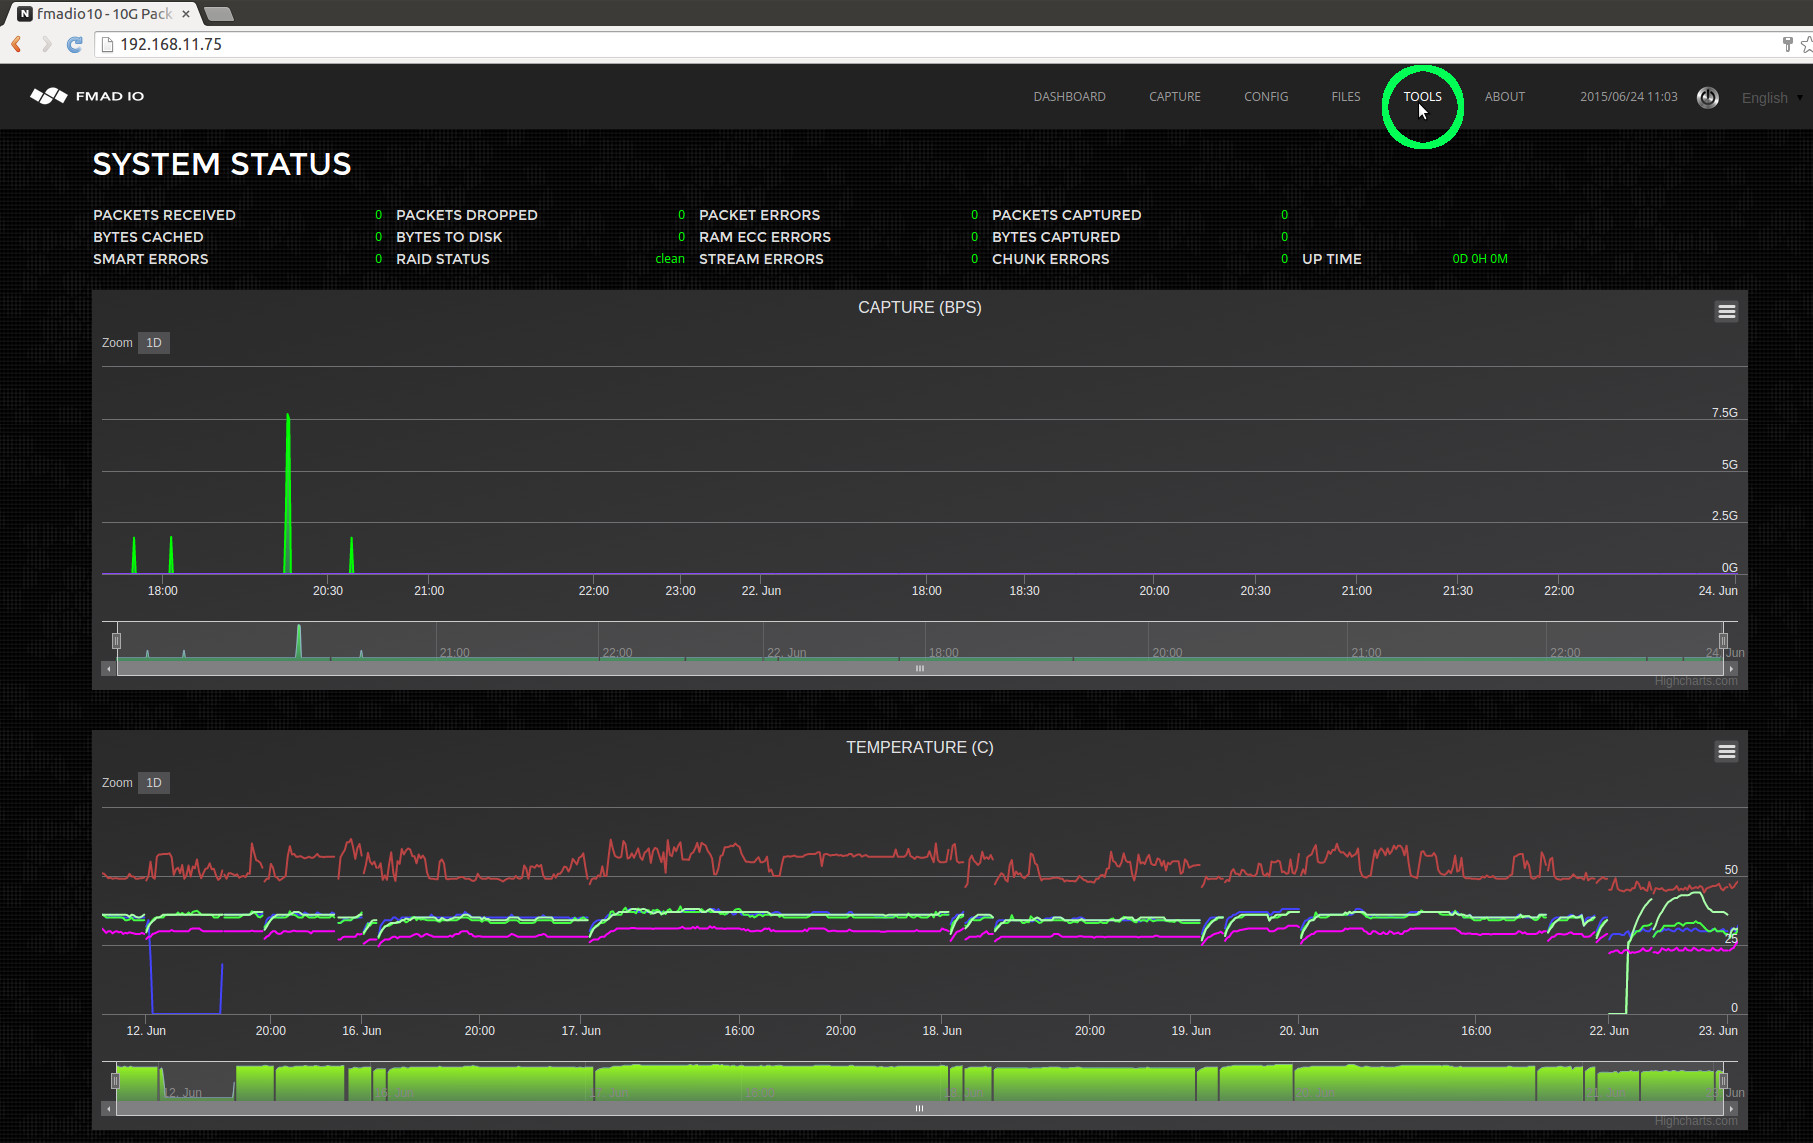
Proceed to the "Tools" page on the capture device`s web page, as highlighted in green in the image below.
Step 3) Select the firmware binary to upload
Scroll down on the Tools page to find and select the "Choose File" firmware button (highlighted in green below)
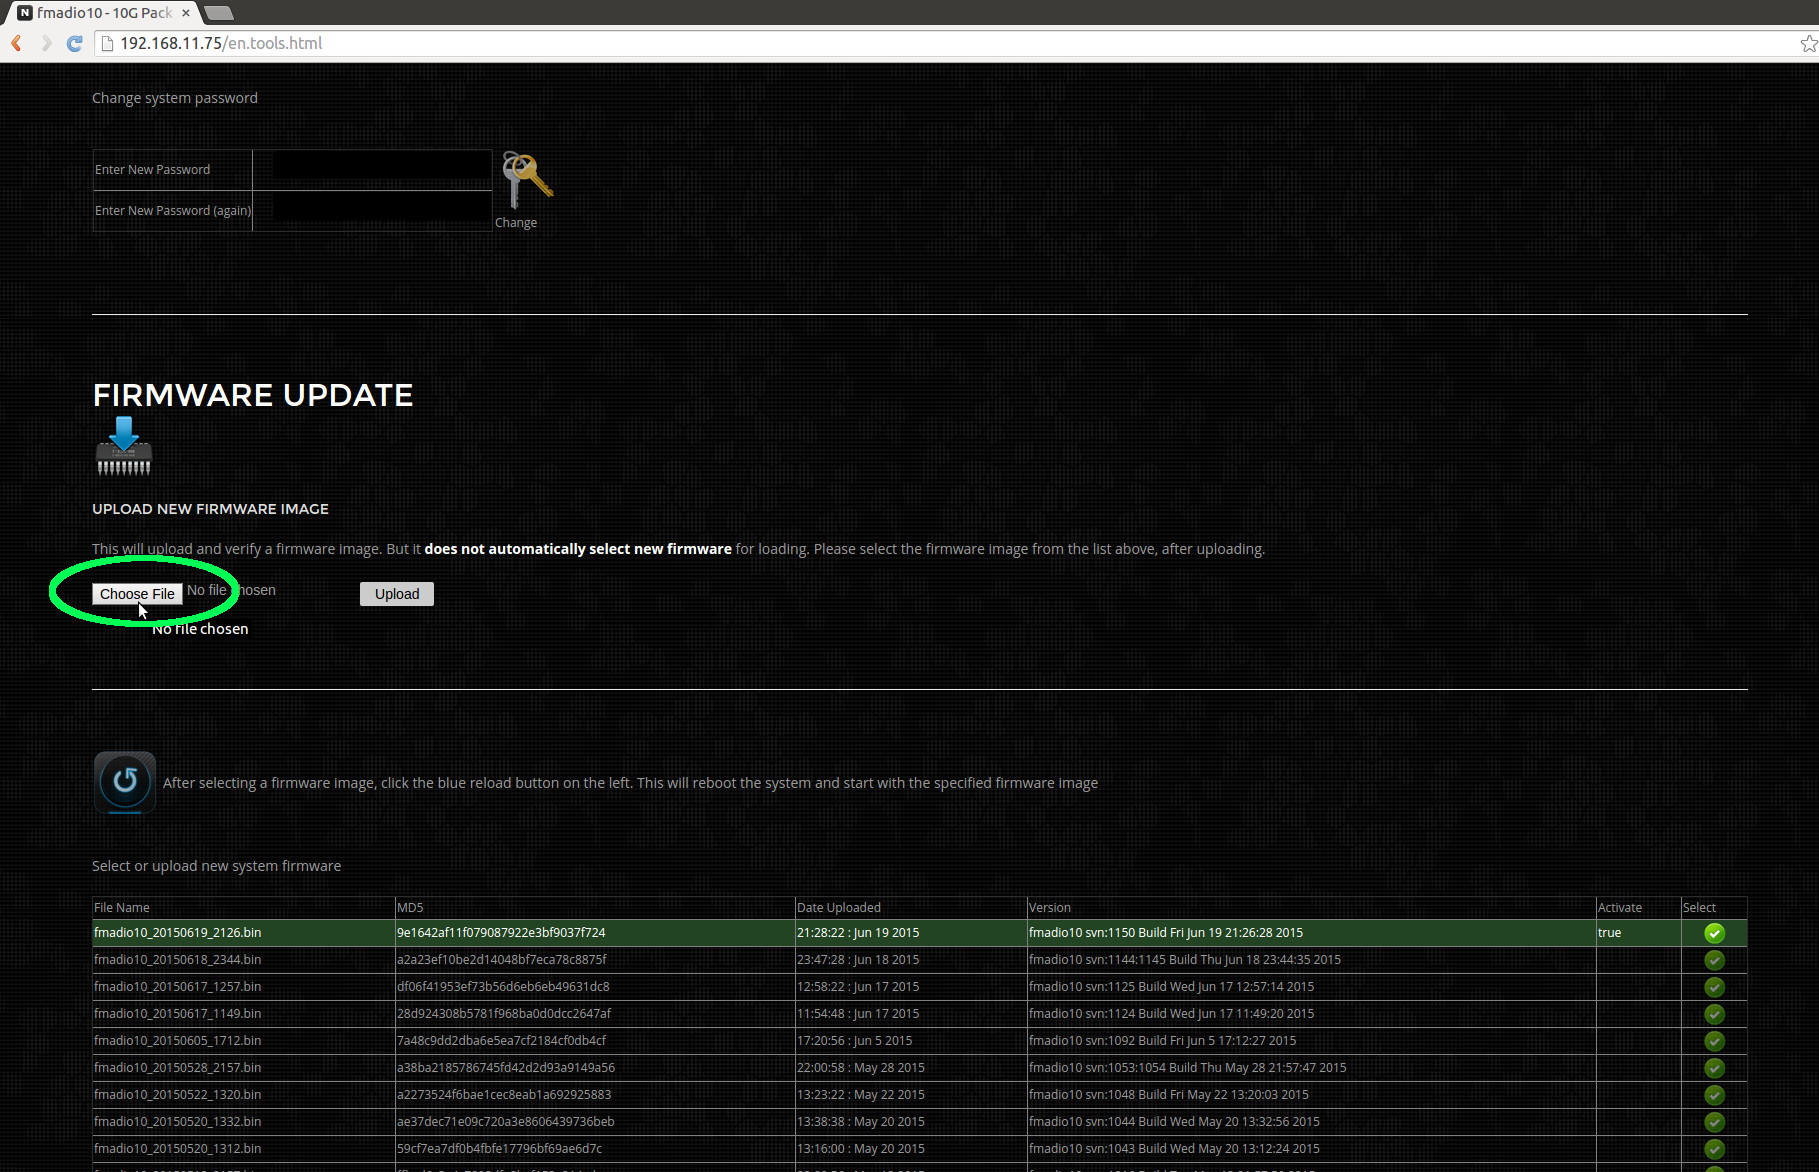
Step 4) Upload the binary
After selecting the appropriate file (in this example fmadio10_20150623_1257.bin) click the upload button to transfer to the capture device. NOTE: this will not change the firmware on the device, only upload it.
The upload status is highlighted in blue below.
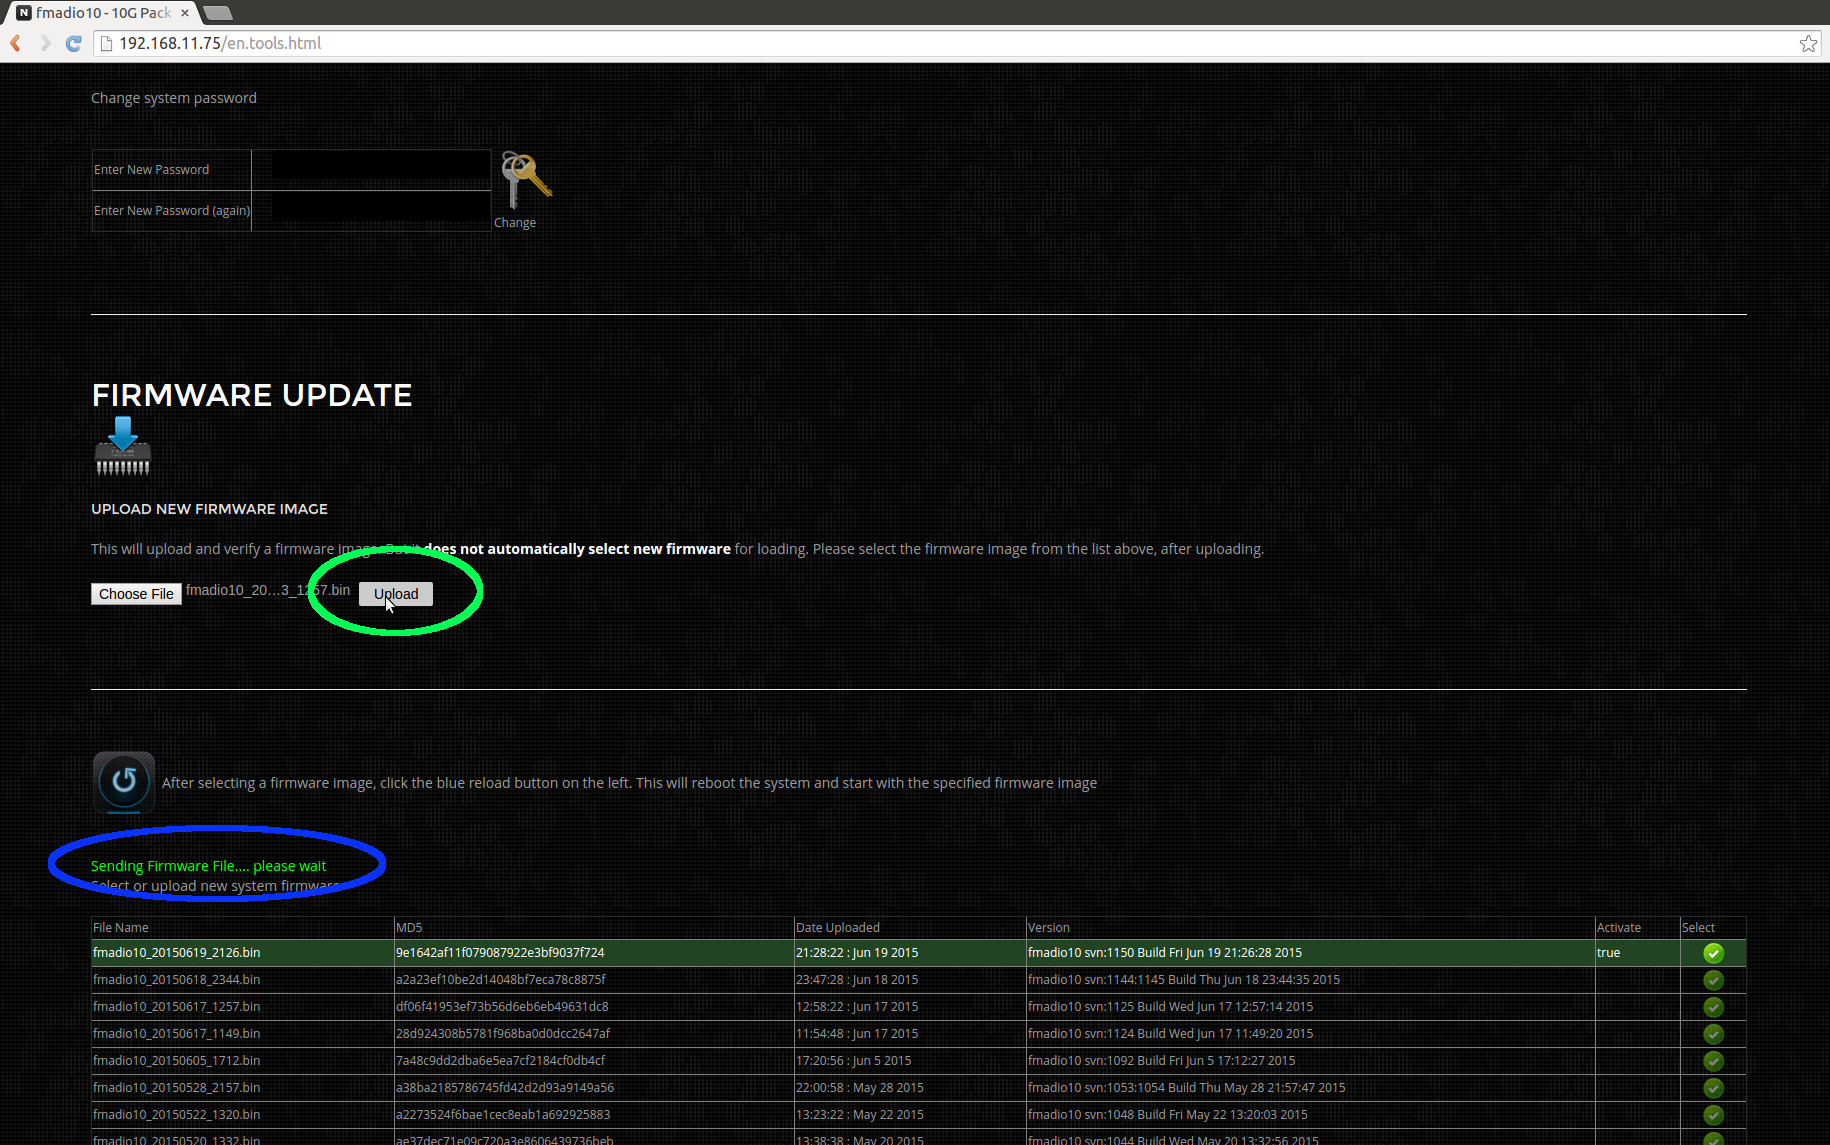
Step 5) Verify firmware was uploaded
After successfully uploading the firmware, the web page will refresh and show a new entry in the firmware list, as shown in green below.

Step 6) Select firmware and reboot
Select the new firmware image by clicking on the green icon (highlighted in green below). The green select button (it will remain highlighted).
After selecting which firmware to use, request the system to update then reboot (highlighted in blue below)

Step 7) Confirm new firmware
It will take 1-2 minutes for the system to reboot and become active again. Once the system is online go to the tools page in the browser and confirm the currently active firmware image is the one just uploaded and selected.
System updates are easy and simple. The device is designed for regular updates as we are constantly adding additional features based on customer requests. This is NOT a standard redhat/ubuntu based linux system, it is a highly customized and controlled embedded linux device.
Think of our devices as Network Switch`s that do Packet Capture.
Firmware Update CLI
Sometimes Firmware updates are easier via the CLI(Command Line interface) than using the Web interface. Following is how a CLI based updated can be performed
Step 1) Download the latest firmware onto the system
Download the latest firmware image from the support website either directly onto the box or scp the image. Please put the image into /tmp/

Step 2) Upload the Firmware into the system
Upload the firmware into the system via the following command
sudo firmware_install.lua --upload fmadioXXXXXXXXX.bin
Example shown below
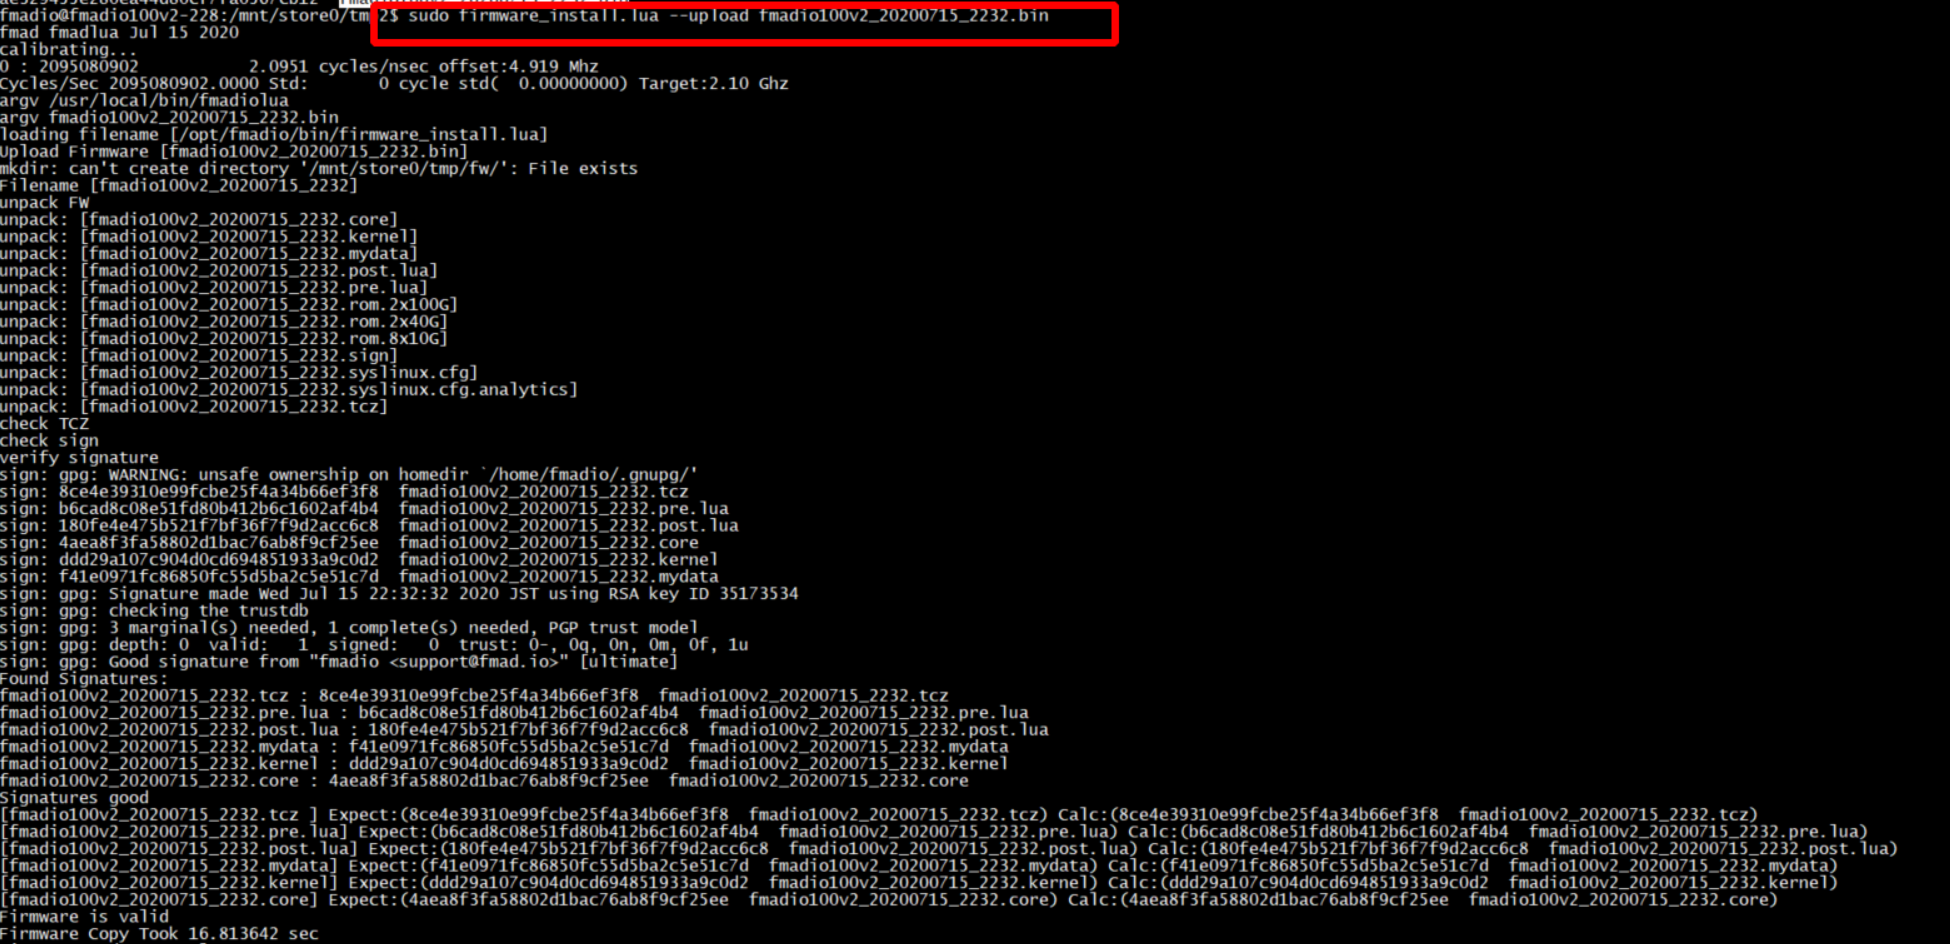
Step 3) Install the Firmware
Install the firmware into the system. NOTE: the filename is NOT a path, it must be filename only
sudo firmware_install.lua --install fmadioXXXXXXXXX.bin
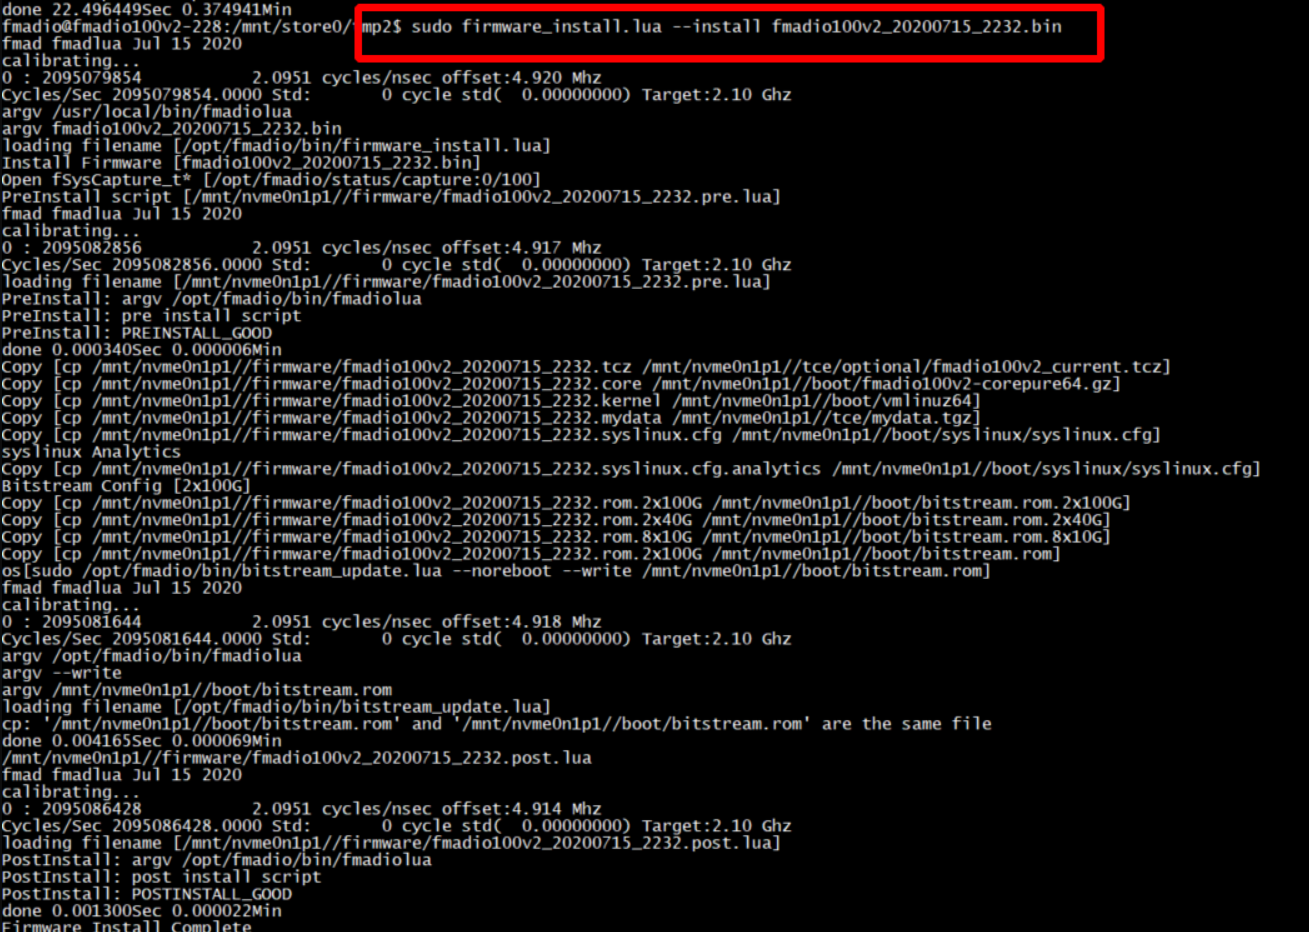
Step 4) Reboot the system
System must then be rebooted, where it will update and install various files. It may reboot / power cycle itself 1 or 2 times depending on which packet capture system.

Step 5) Verify firmware version
After successfully installing the firmware confirm the firmware version as follows
cat /opt/fmadio/version

Change Hostname
Having the appropriate hostname can make server management alot simpler. By default all systems have a "fmadio-XXX" host name that is unique to each system deployed. Changing the host name is simple with the following steps
Step 1) Log into the system
SSH into the fmadio10 device
$ ssh fmadio@192.168.11.75
fmadio@192.168.11.75's password:
  _____                    .___.__      10G
_/ ____\_____  _____     __| _/|__|  ____
\   __\/     \ \__  \   / __ | |  | /  _ \
 |  | |  Y Y  \ / __ \_/ /_/ | |  |(  <_> )
 |__| |__|_|  /(____  /\____ | |__| \____/
            \/      \/      \/
============================================
  -+ no user serviceable parts inside +-

fmadio@fmadio10-049:~$
Step 2) Change to the configuration directory
fmadio@fmadio10-049:~$ cd /mnt/store0/etc
fmadio@fmadio10-049:/mnt/store0/etc$
Step 3) Display the current host name
fmadio@fmadio10-049:/mnt/store0/etc$ cat hostname
fmadio10-049
fmadio@fmadio10-049:/mnt/store0/etc$
Step 4) Set new hostname
Use your preferred editor or even command to edit the hostname file. For example:
fmadio@fmadio10-049:/mnt/store0/etc$ sudo echo "my.new.hostname" > hostname
fmadio@fmadio10-049:/mnt/store0/etc$
Step 5) Power cycle the system
For the change to take effect, please reboot the system.
fmadio@fmadio10-049:/mnt/store0/etc$ sudo reboot
fmadio@fmadio10-049:/mnt/store0/etc$ Connection to 192.168.11.75 closed by remote host.
Step 6) Complete
Next time you login the hostname is the new updated value, in this case "my.new.hostname"
fmadio@my.new.hostname:/mnt/store0/etc$
RAID5 configuration
FMADIO10/20 can be configured as 12TB in a RAID5 configuration. The procedure is simple, but it destroys all data on the system thus care is required. In addition to the initial procedure, RAID5 systems require 8 hours to complete initialization of the drive. During this time the system performance is reduced.
Step 1) Log into the system
SSH into the fmadio10 device
$ ssh fmadio@192.168.11.75
fmadio@192.168.11.75's password:
  _____                    .___.__      10G
_/ ____\_____  _____     __| _/|__|  ____
\   __\/     \ \__  \   / __ | |  | /  _ \
 |  | |  Y Y  \ / __ \_/ /_/ | |  |(  <_> )
 |__| |__|_|  /(____  /\____ | |__| \____/
            \/      \/      \/
============================================
  -+ no user serviceable parts inside +-

fmadio@fmadio10-049:~$
Step 2) Issue disk format command
From the command line, enter the following options.
fmadio@fmadio10-049:~$ cd /opt/fmadio/bin
fmadio@fmadio10-049:/opt/fmadio/bin$ ./format_raid.lua --raid5
fmad fmadlua Aug 11 2015
calibrating...
0 : 00000000d09daaff           3.5000 cycles/nsec
Cycles/Sec 3499993855.0000 Std:       0cycle std(  0.00000000)
loading filename [./format_raid.lua]
done: 0 0
done 3.023745Sec 0.050396Min
fmadio@fmadio10-049:/opt/fmadio/bin$ Connection to 192.168.11.75 closed by remote host.
Connection to 192.168.11.75 closed.
aaron@display0:~$
The system will now perform a series of system initialization and reboots. It will take about 5 minutes to complete.
Step 3) After about 5 minutes, login and check the RAID5 status
After about 5 minutes, the system will have completed the change. To check its status run the following SSH commands.
aaron@display0:~$ ssh fmadio@192.168.11.75
fmadio@192.168.11.75's password:
  _____                    .___.__      10G
_/ ____\_____  _____     __| _/|__|  ____
\   __\/     \ \__  \   / __ | |  | /  _ \
 |  | |  Y Y  \ / __ \_/ /_/ | |  |(  <_> )
 |__| |__|_|  /(____  /\____ | |__| \____/
            \/      \/      \/
============================================
  -+ no user serviceable parts inside +-
fmadio@fmadio10-049:~$ sudo mdadm --detail /dev/md0
/dev/md0:
        Version : 1.2
  Creation Time : Wed Aug 12 08:52:10 2015
     Raid Level : raid5
     Array Size : 11720662464 (11177.70 GiB 12001.96 GB)
  Used Dev Size : 3906887488 (3725.90 GiB 4000.65 GB)
   Raid Devices : 4
  Total Devices : 4
    Persistence : Superblock is persistent

  Intent Bitmap : Internal

    Update Time : Wed Aug 12 08:58:46 2015
          State : active, degraded, recovering
 Active Devices : 3
Working Devices : 4
 Failed Devices : 0
  Spare Devices : 1

         Layout : left-symmetric
     Chunk Size : 64K

 Rebuild Status : 0% complete

           Name : fmadio10-049:0  (local to host fmadio10-049)
           UUID : a6d5fc4b:dbb7f274:7918601a:938c8451
         Events : 202

    Number   Major   Minor   RaidDevice State
       0       8      112        0      active sync   /dev/sdh
       1       8       64        1      active sync   /dev/sde
       2       8       96        2      active sync   /dev/sdg
       4       8       80        3      spare rebuilding   /dev/sdf
fmadio@fmadio10-049:~$
The above shows the array is rebuilding. To get a better idea on its progress and completion time, check the following file.
fmadio@fmadio10-049:~$ cat /proc/mdstat
Personalities : [raid6] [raid5] [raid4] [raid0]
md1 : active raid0 sdb2[0] sdi2[3] sdd2[2] sdc2[1]
468594688 blocks super 1.2 64k chunks
md0 : active raid5 sdh[0] sdf[4] sdg[2] sde[1]
11720662464 blocks super 1.2 level 5, 64k chunk, algorithm 2 [4/3] [UUU_]
[>....................] recovery = 0.9% (37383872/3906887488) finish=481.4min speed=133952K/sec
bitmap: 1/30 pages [4KB], 65536KB chunk
unused devices:
In the above example, there are 481minutes or about 8 Hours remaining to complete initialization
Step 4) Confirm web GUI is rebuilding
Point the browser to the dashboard page, to confirm the RAID5 array is rebuilding
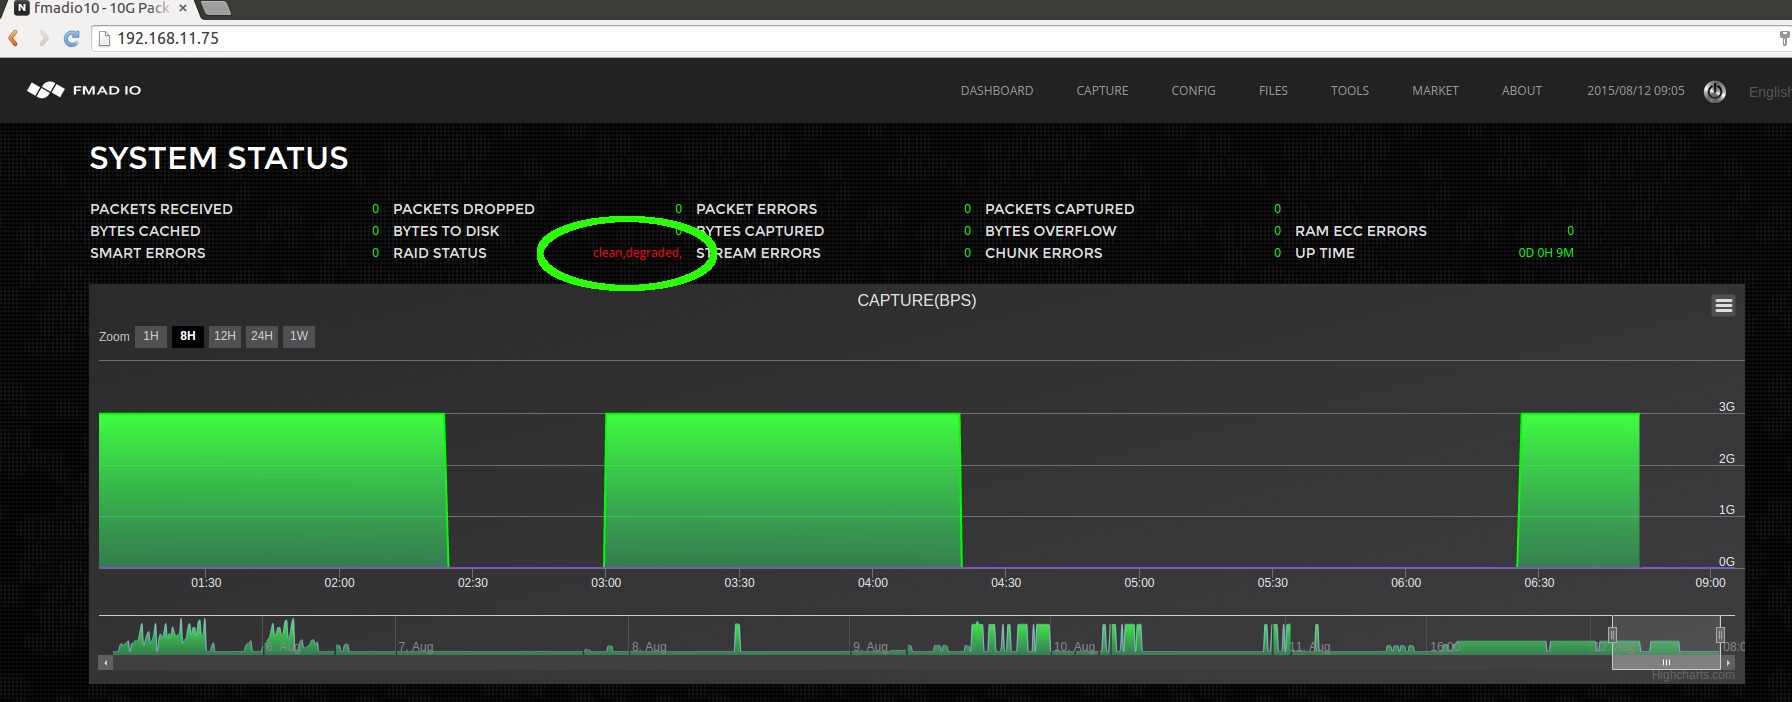
The above image shows the RAID Status as degraded and rebuilding. It will take about 8 hours for this to complete.
Step 5) Confirm web GUI file system
Click on the "Files" browser tab to list all captures. There should be no captures, as the file system has just been formatted.

Step 6) Wait for RAID5 rebuild to complete
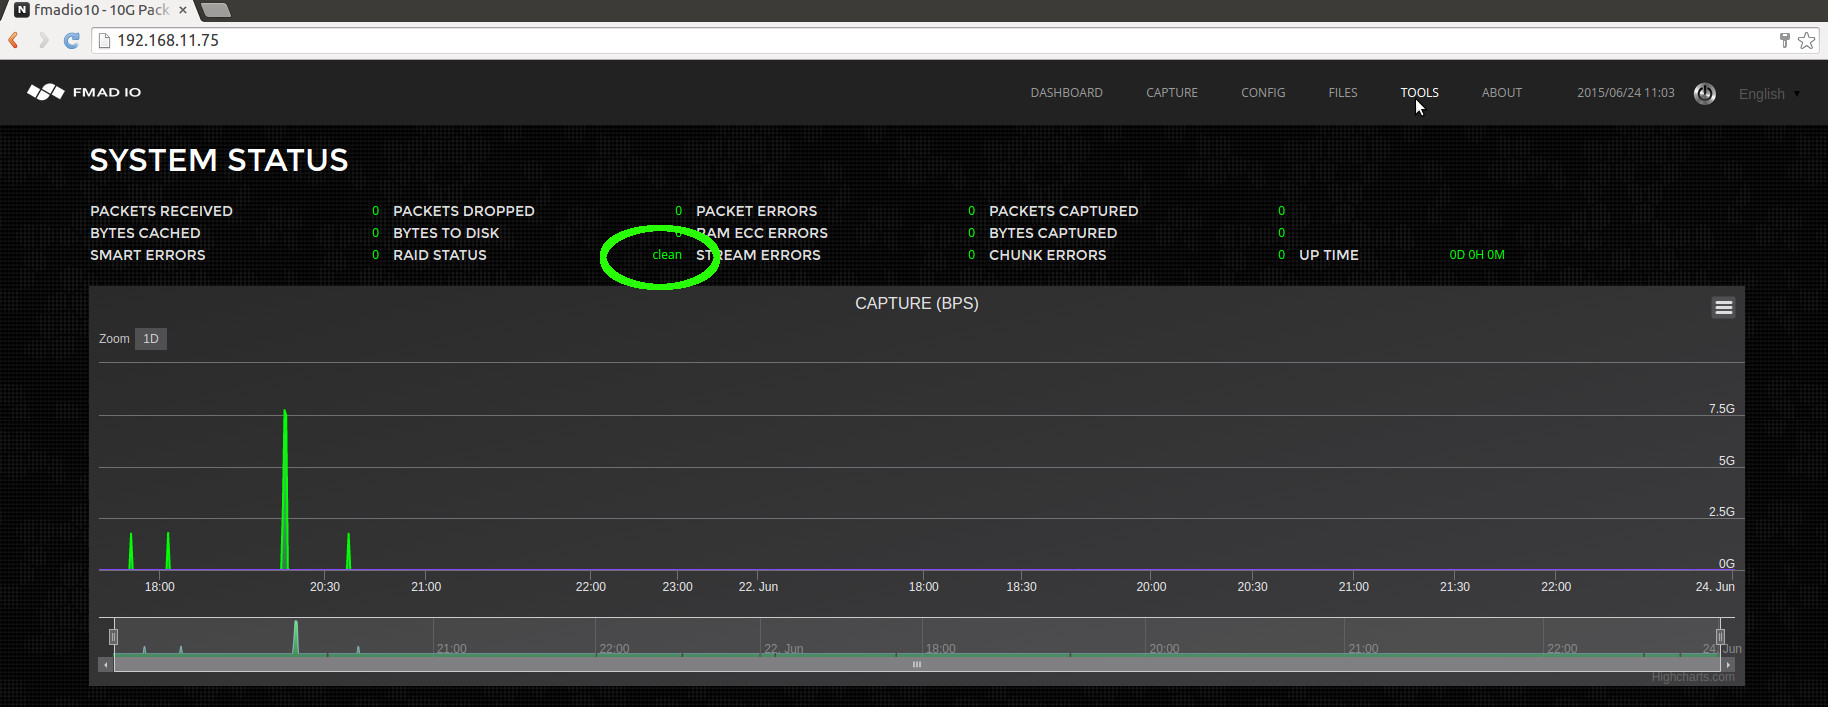
After about 8 hours, the RAID5 filesystem will be completely rebuilt. To confirm rebuild has completed successfully
the below "clean" RAID Status (highlighted in green) shows the RAID5 filesystem has been successfully rebuilt, and ready for operation.
Step 7) Complete
System is now ready for all capture workloads.
RAID0 configuration
FMADIO10/20 can be configured as 16TB in a RAID0 configuration. RAID0 primary benefit is larger disk space and high performance. However a single disk failure will result in data loss. The following steps show how to configure the system for RAID0, it does not require an array rebuild and can be used immediately.
Step 1) Log into the system
SSH into the fmadio10 device
$ ssh fmadio@192.168.11.75
fmadio@192.168.11.75's password:
  _____                    .___.__      10G
_/ ____\_____  _____     __| _/|__|  ____
\   __\/     \ \__  \   / __ | |  | /  _ \
 |  | |  Y Y  \ / __ \_/ /_/ | |  |(  <_> )
 |__| |__|_|  /(____  /\____ | |__| \____/
            \/      \/      \/
============================================
  -+ no user serviceable parts inside +-

fmadio@fmadio10-049:~$
Step 2) Issue RAID0 disk format command
From the command line, enter the following options.
fmadio@fmadio10-049:~$ cd /opt/fmadio/bin/
fmadio@fmadio10-049:/opt/fmadio/bin$ ./format_raid.lua  --raid0
fmad fmadlua Aug 11 2015
calibrating...
0 : 00000000d09da89a           3.5000 cycles/nsec
Cycles/Sec 3499993242.0000 Std:       0cycle std(  0.00000000)
loading filename [./format_raid.lua]
done: 0 0
done 3.116626Sec 0.051944Min
fmadio@fmadio10-049:/opt/fmadio/bin$ Connection to 192.168.11.75 closed by remote host.
Connection to 192.168.11.75 closed.
aaron@display0:~$
The system will now perform a series of system initialization and reboots, this will take about 5 minutes to complete.
Step 3) After about 5 minutes, login and check RAID0 initialization has completed
After about 5 minutes, the system will have completed the change. To check its status run the following SSH commands.
aaron@display0:~$ ssh fmadio@192.168.11.75
fmadio@192.168.11.75's password:
X11 forwarding request failed on channel 0
  _____                    .___.__      10G
_/ ____\_____  _____     __| _/|__|  ____
\   __\/     \ \__  \   / __ | |  | /  _ \
 |  | |  Y Y  \ / __ \_/ /_/ | |  |(  <_> )
 |__| |__|_|  /(____  /\____ | |__| \____/
            \/      \/      \/
============================================
  -+ no user serviceable parts inside +-
fmadio@fmadio10-049:~$ sudo mdadm --detail /dev/md0
/dev/md0:
        Version : 1.2
  Creation Time : Wed Aug 12 09:39:50 2015
     Raid Level : raid0
     Array Size : 15627549952 (14903.59 GiB 16002.61 GB)
   Raid Devices : 4
  Total Devices : 4
    Persistence : Superblock is persistent

    Update Time : Wed Aug 12 09:39:50 2015
          State : clean
 Active Devices : 4
Working Devices : 4
 Failed Devices : 0
  Spare Devices : 0

     Chunk Size : 64K

           Name : fmadio10-049:0  (local to host fmadio10-049)
           UUID : 42d3cf0d:92b4e95c:1cee3e93:fdd2558b
         Events : 0

    Number   Major   Minor   RaidDevice State
       0       8      112        0      active sync   /dev/sdh
       1       8       64        1      active sync   /dev/sde
       2       8       96        2      active sync   /dev/sdg
       3       8       80        3      active sync   /dev/sdf
fmadio@fmadio10-049:~$
Step 4) Confirm web GUI RAID status is clean
Point the browser to the dashboard page, to confirm the RAID0 array is clean (highlighted in green)

Step 5) Confirm web GUI file system
Click on the "Files" browser tab to list all captures. There should be no captures, as the file system has just been formatted.

Step 6) Complete
System is now ready for all capture workloads.
iSCSI Storage
Standard FMAD10/20 systems can use up to 300TB of remote iSCSI target storage for long term packet capture. By default All systems are configured to utilize the local 16TB of 3.5" HDD storage in RAID0 or RAID5. This section describes how to configure a remote iSCSI backend storage device.
Step 1) Navigate to the Config page
Click on the "CONFIG" menu bar at the top of the screen as shown in green below.
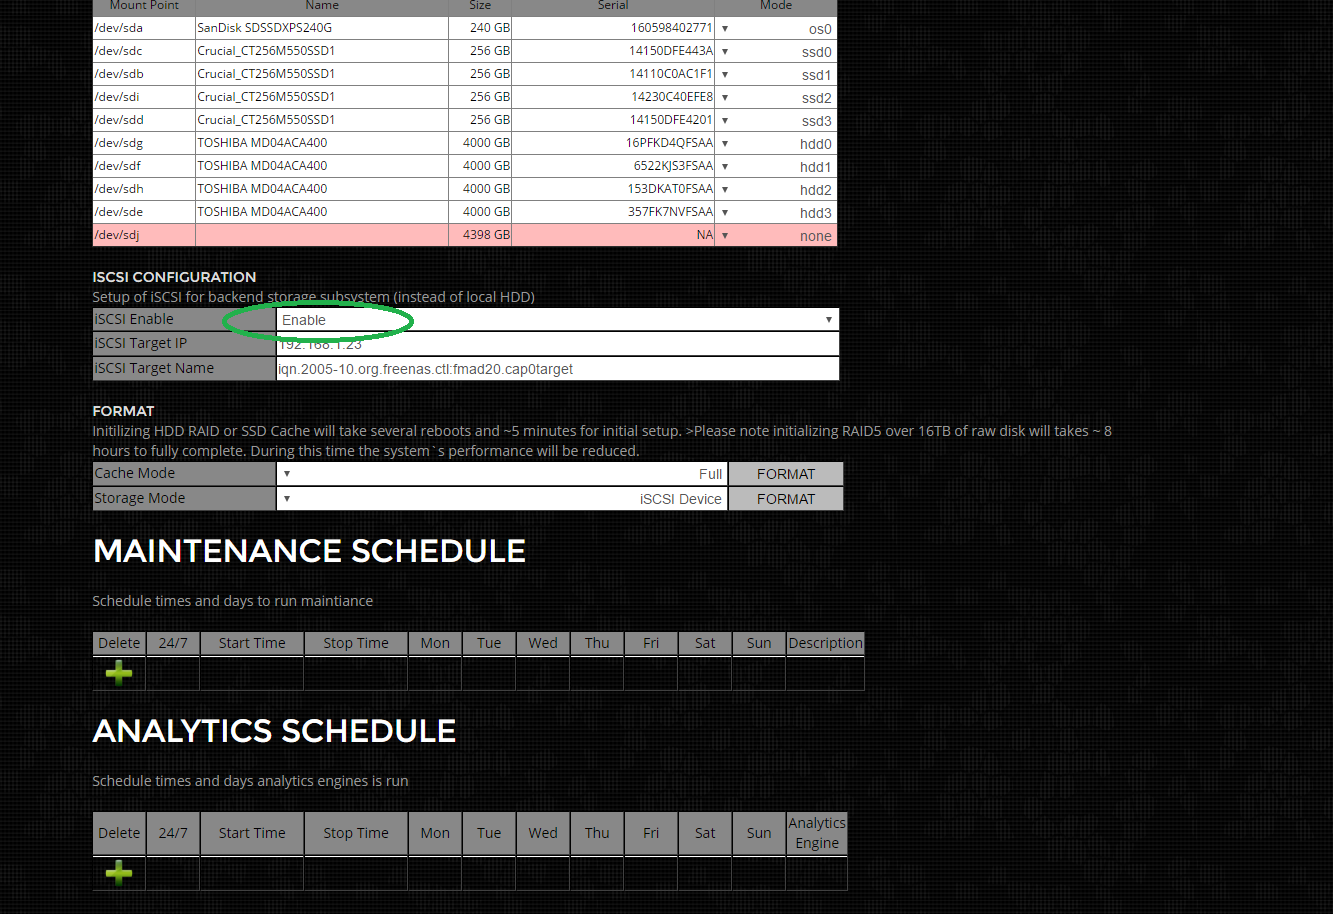
Step 2) Enable iSCSI Backend
Select "Enable" from the drop down menu as highlighted in green
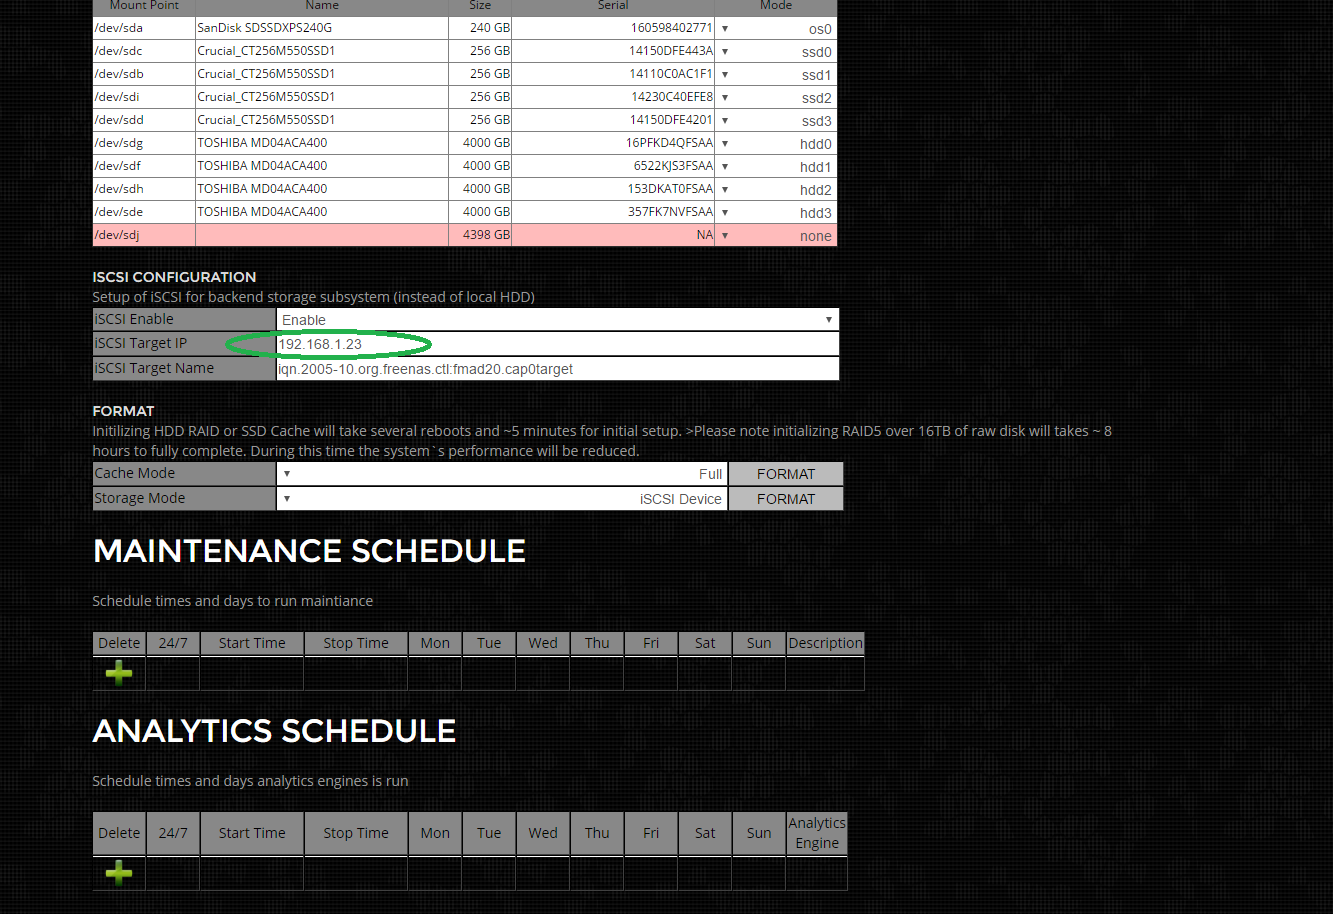
Step 3) Set iSCSI Target`s IP Address
Enter the full IP address of the iSCSI target device
Step 4) Set iSCSI Target Name
Enter the full iSCSI Target name, as highlighted in green below
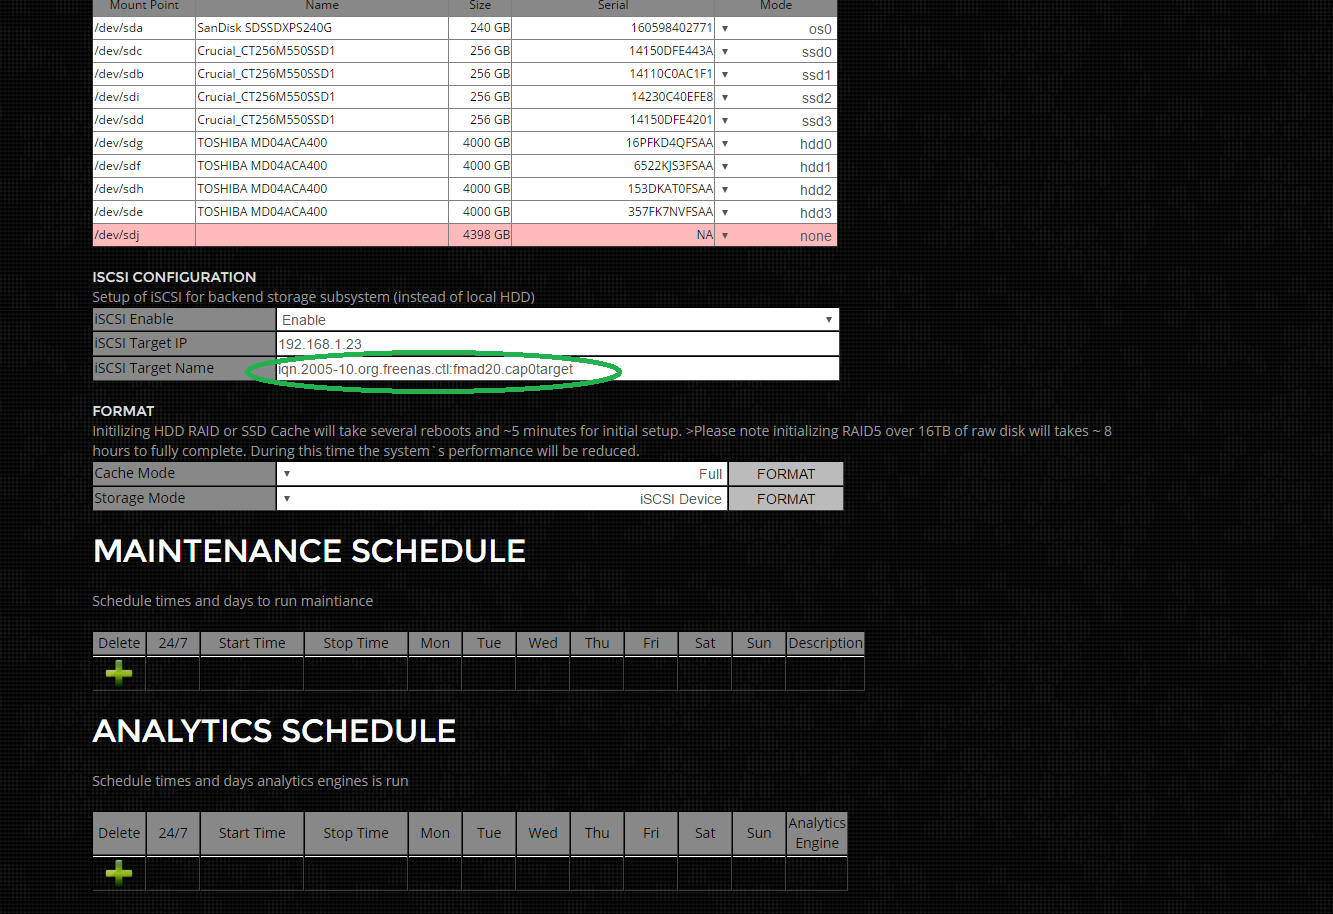
Step 5) Format iSCSI Target Storage
Now need to re-format the storage system to utilize the iSCSI target. This is an un-recoverable operation that destroys all previous capture data on the system. THIS IS AN UNRECOVERABLE OPERATION. Start by selecting "iSCSI" from the Storage Mode menu as highlighted in green below.
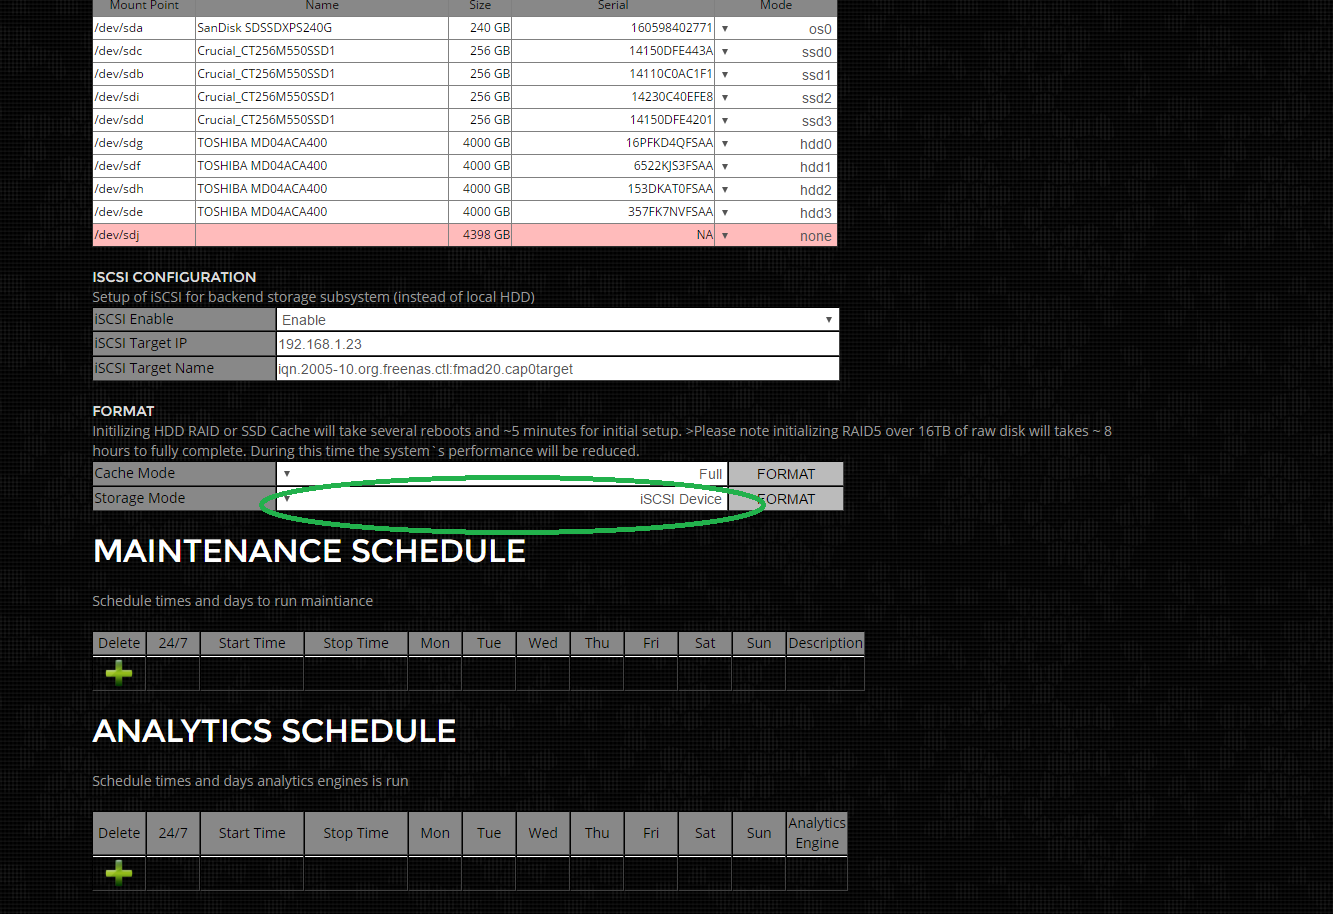
Then click on the FORMAT button next to it. This will prompt with a confirmation dialog box and then a system message. This operation reboots the systems multiple times during storage initialization. It can take 5-30min depending on the size of the iSCSI Target device.
SNMP Setup with NAGIOS
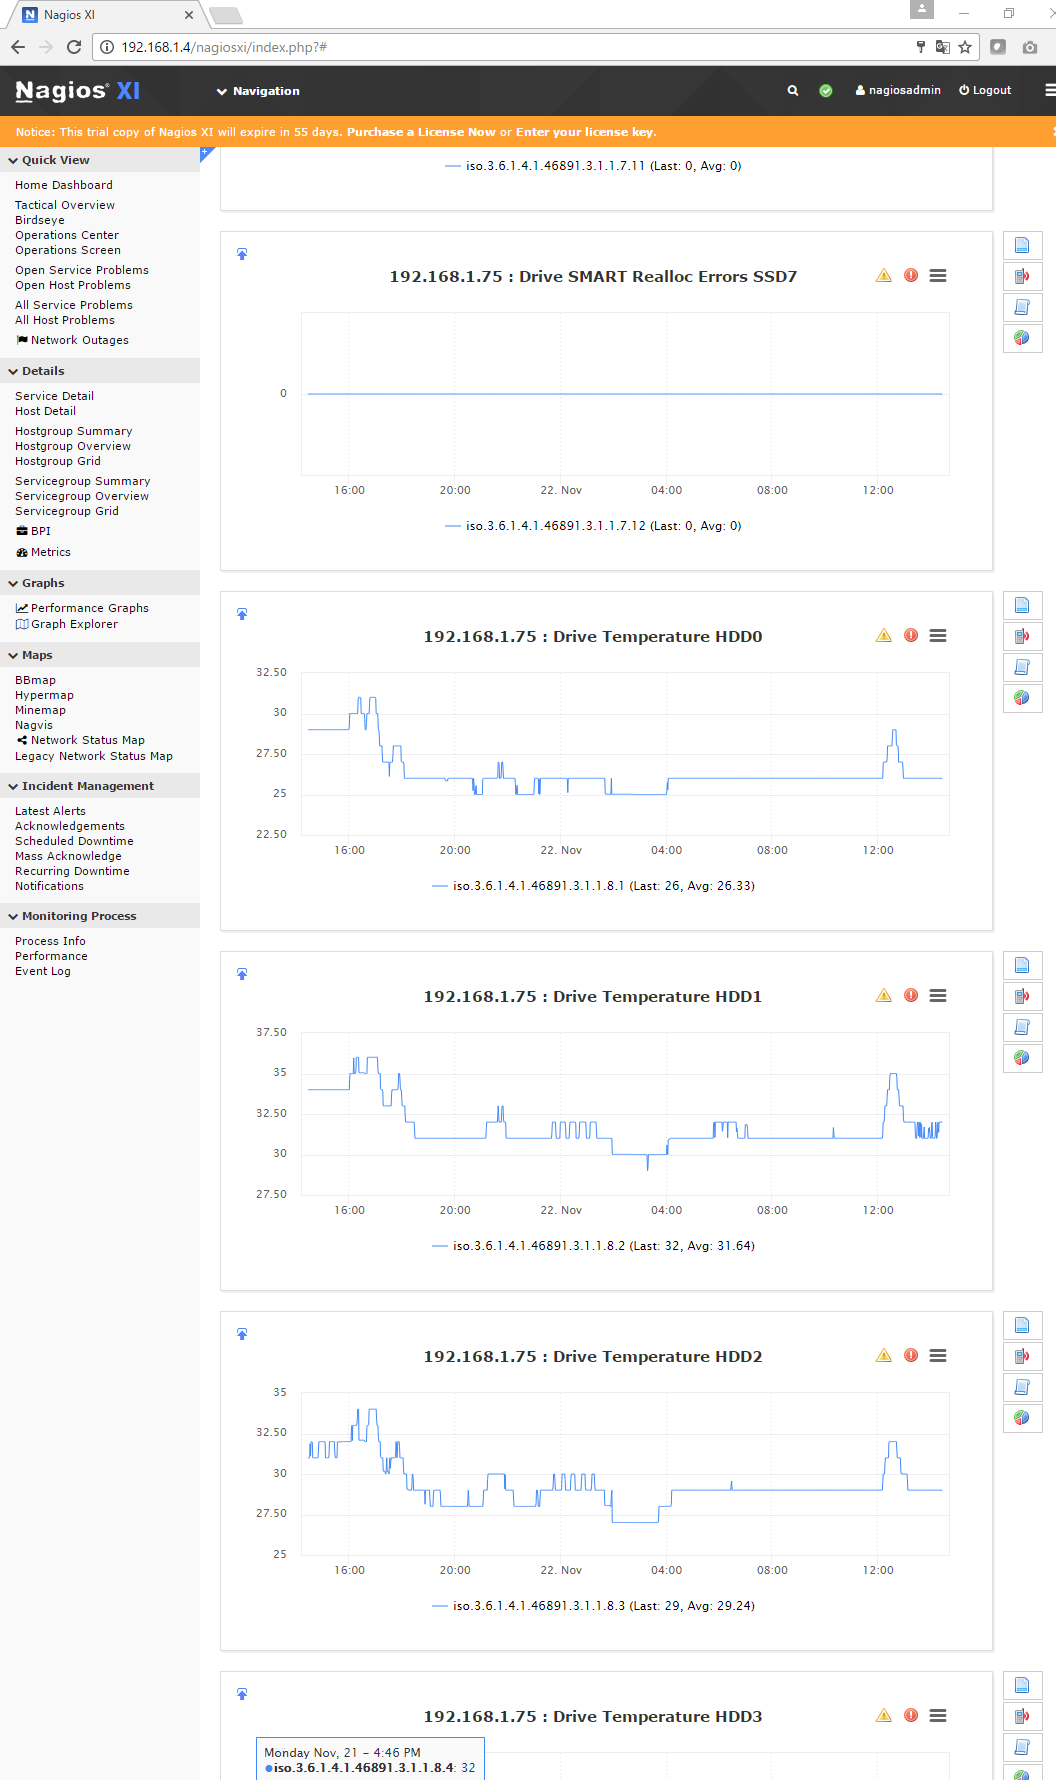
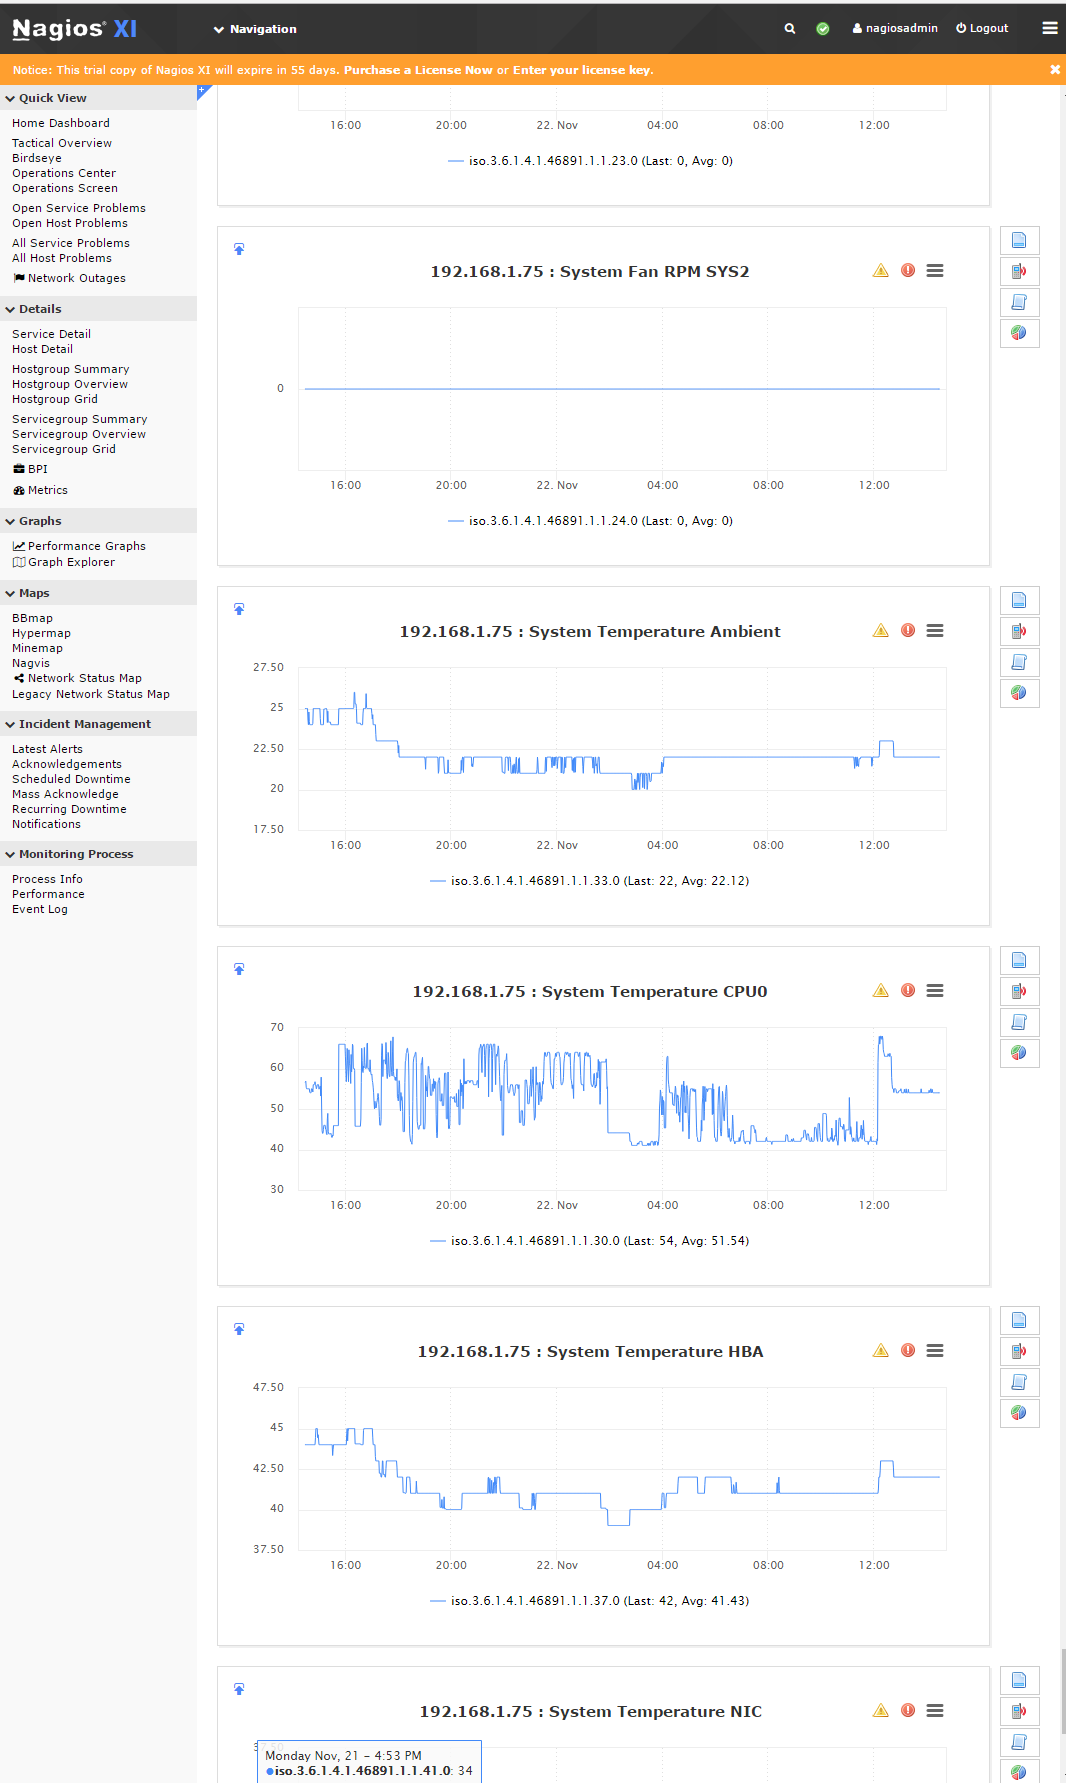
Nagios XI is an excellent and popular system monitoring software used extensively thought the IT industry. Its extremely flexible and all FMAD devices now have full support. To setup and install FMAD device into NAGIOS follow the following steps.
1) Install the basic Linux SNMP target as shown in red below. Use all the default settings.
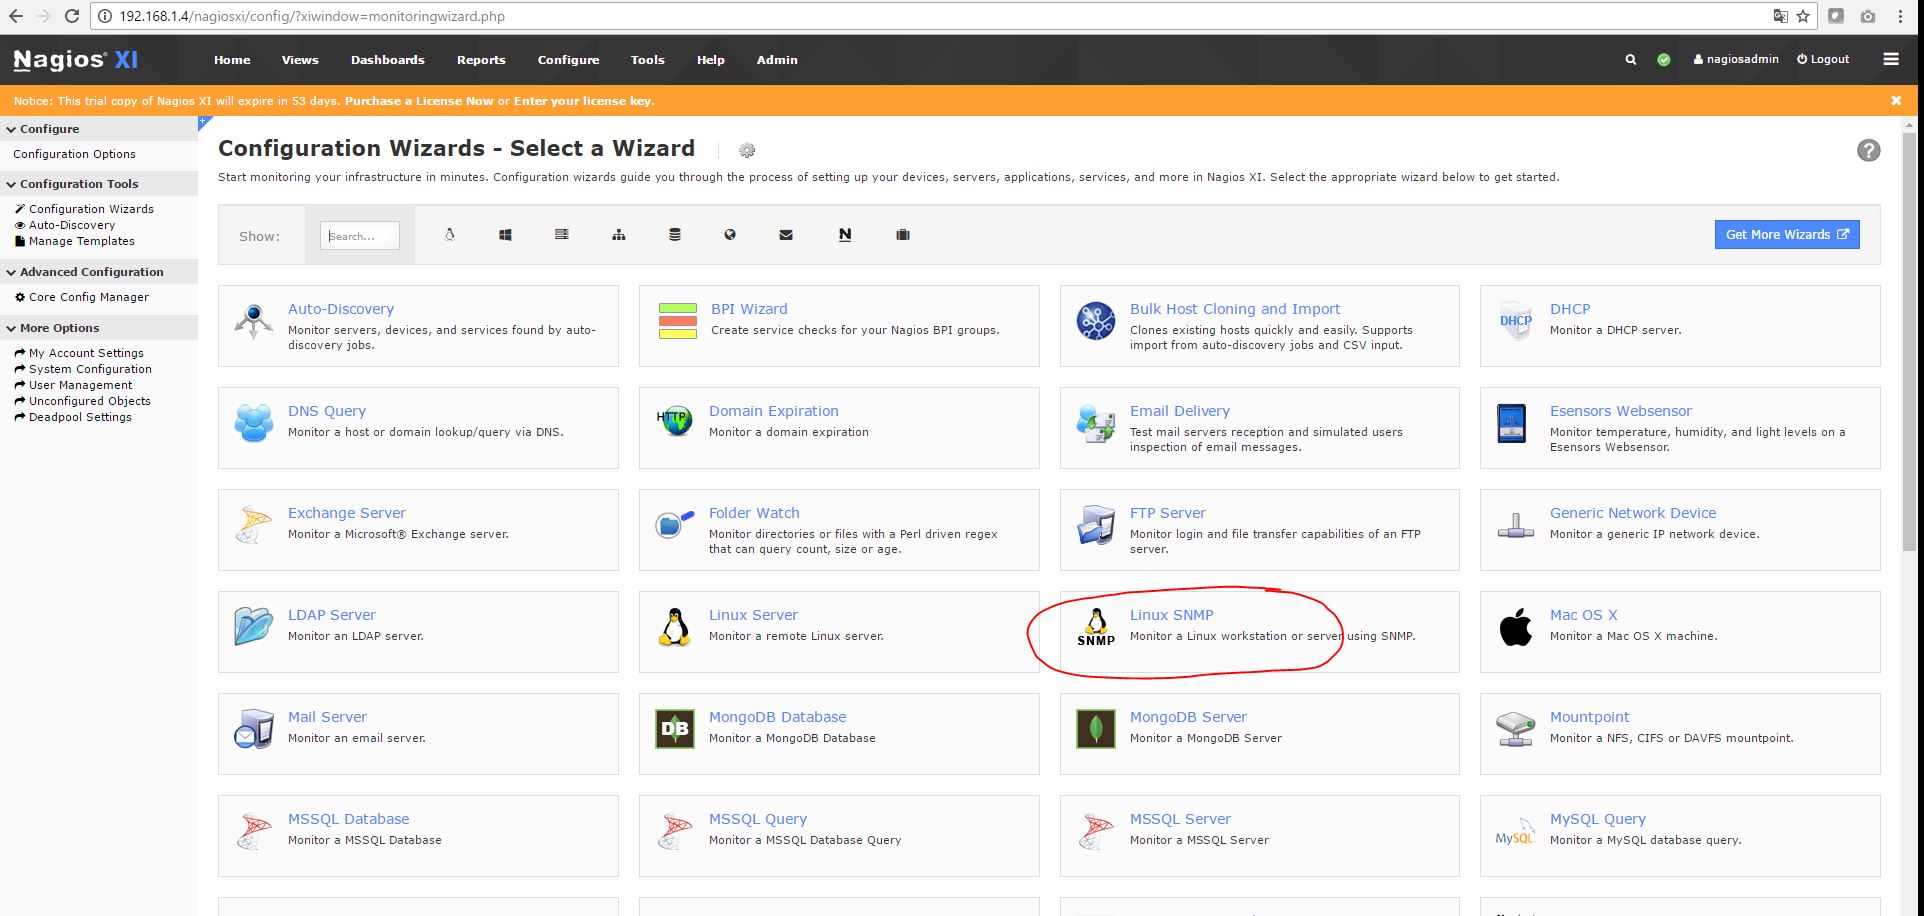
2) Enter FMAD management port IP address (as shown in Red)
This sets up basic Linux SNMP monitoring.

3) Continue and finish using the default settings
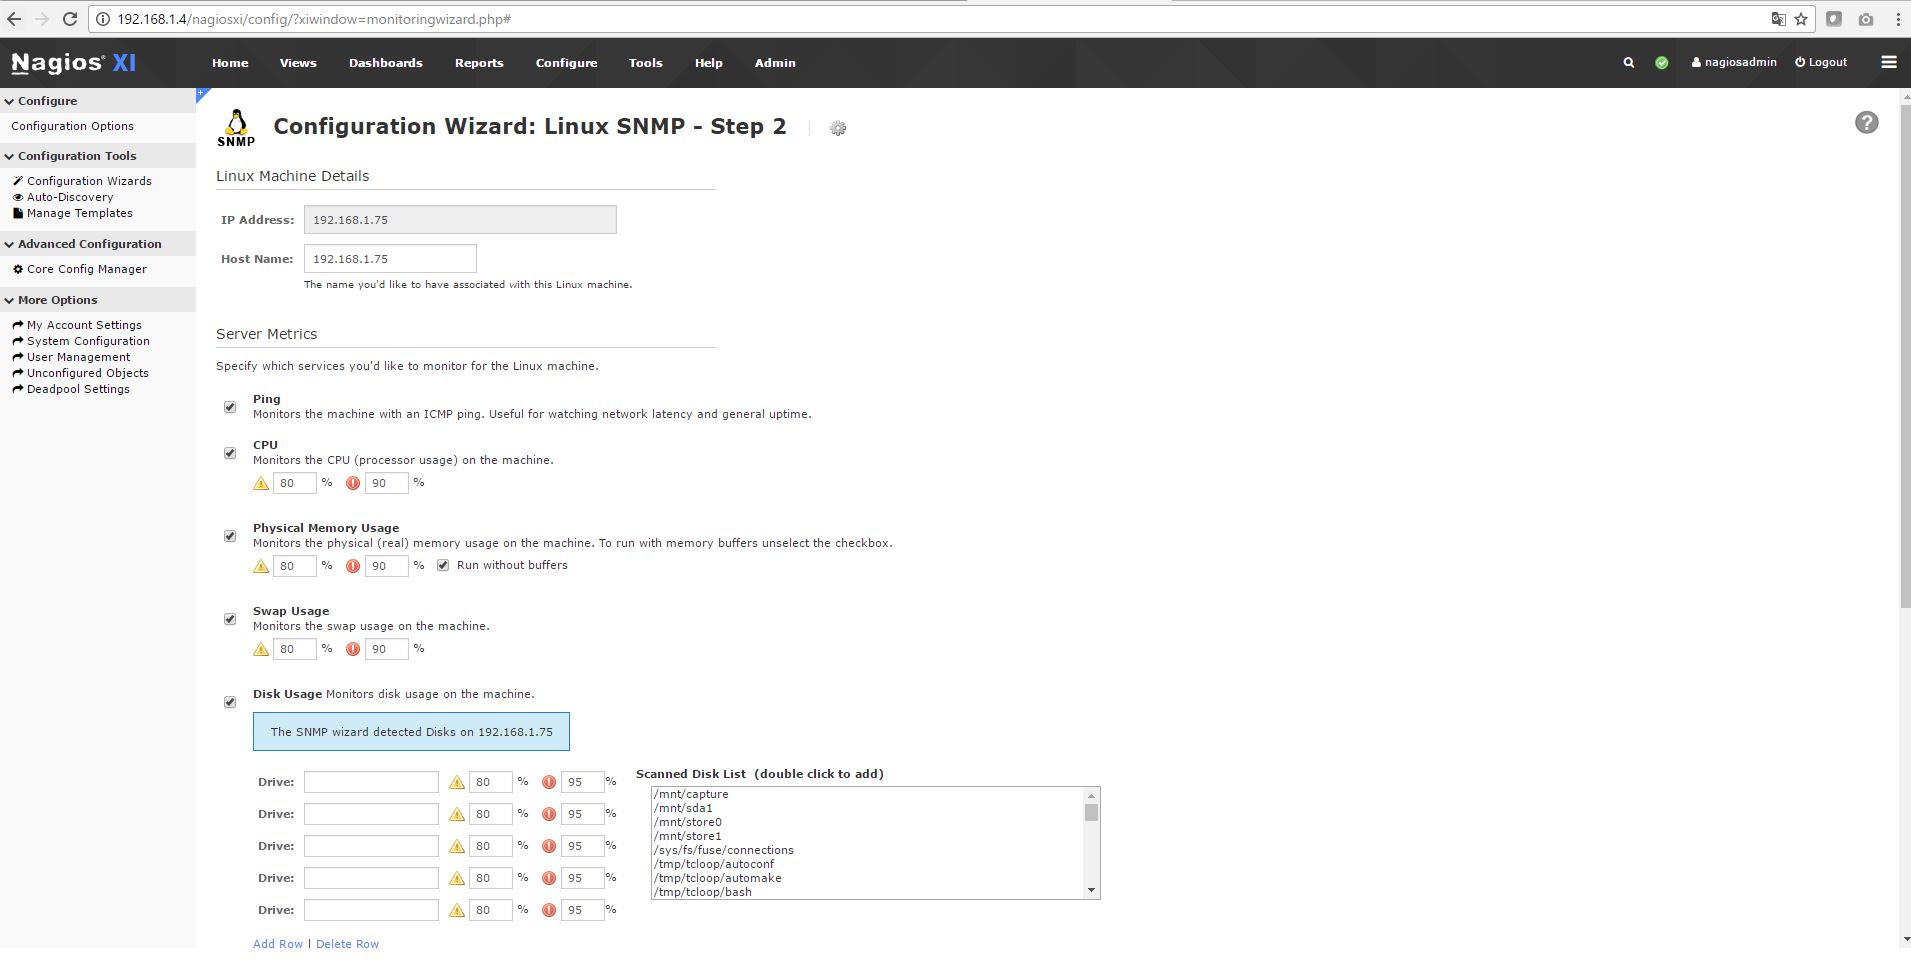

4) Generate custom Nagios FMAD configuration file
Generate a Nustom nagios services configuration file, or replace the IP/name of the checked in file.
Generator script is located here:
https://github.com/fmadio/fmadio_scripts/blob/master/snmp/nagios_xi_service_gen.lua
Example usage is as follows:
$ ./nagios_xi_service_gen.lua  --host 192.168.1.75 --fmad20-1u-16t
--host
--fmad20-1u-16t
Generating for [fmadio20] at host [192.168.1.75]
$
There will now be a nagios services configuration file in the local directory. In this case "192.168.1.75.cfg"
OR
Modify the checked in file, and rename all the IP address. Example services config file:
https://github.com/fmadio/fmadio_scripts/blob/master/snmp/192.168.1.75.cfg
$ ls -al
total 116
drwxrwxr-x 2 aaron aaron  4096 11月 24 02:42 .
drwxrwxr-x 4 aaron aaron  4096 11月 22 09:42 ..
-rw-rw-r-- 1 aaron aaron 70709 11月 24 02:42 192.168.1.75.cfg
-rwxrwxr-x 1 aaron aaron 23765 11月 22 09:42 FMADIO-MIB.txt
-rwxrwxr-x 1 aaron aaron  9704 11月 24 02:42 nagios_xi_service_gen.lua
5) Copy services file to nagios server
On the nagios server there is a list of service configuration files.
[root@localhost services]# pwd
/usr/local/nagios/etc/services
[root@localhost services]# ls -al
total 140
drwsrwsr-x 2 apache nagios  4096 Nov 20 14:27 .
drwsrwsr-x 7 apache nagios  4096 Nov 17 22:48 ..
-rw-rw-r-- 1 apache nagios 70709 Nov 19 00:33 192.168.1.75.cfg
-rw-rw-r-- 1 apache nagios  3118 Nov  2 04:07 localhost.cfg
[root@localhost services]#
scp and overwrite the current IP.cfg file with the one generated above
$ scp 192.168.1.75.cfg  root@192.168.1.4:/usr/local/nagios/etc/services/
root@192.168.1.4's password:
192.168.1.75.cfg
$
6) Reload the Nagios configuration
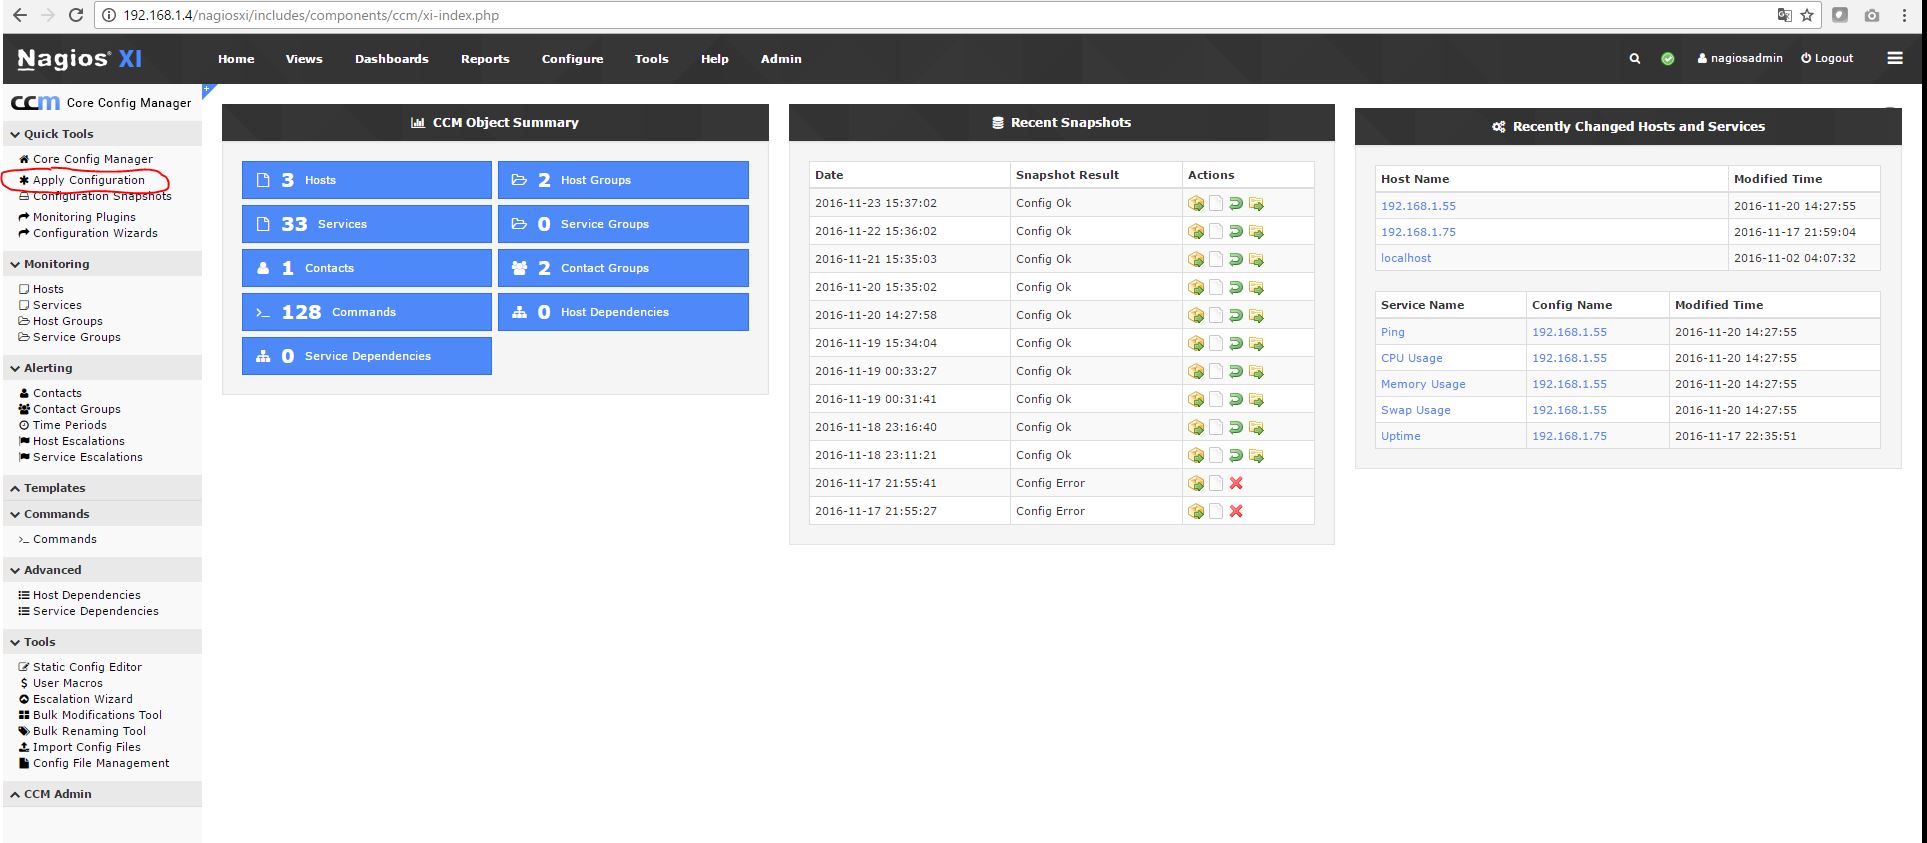
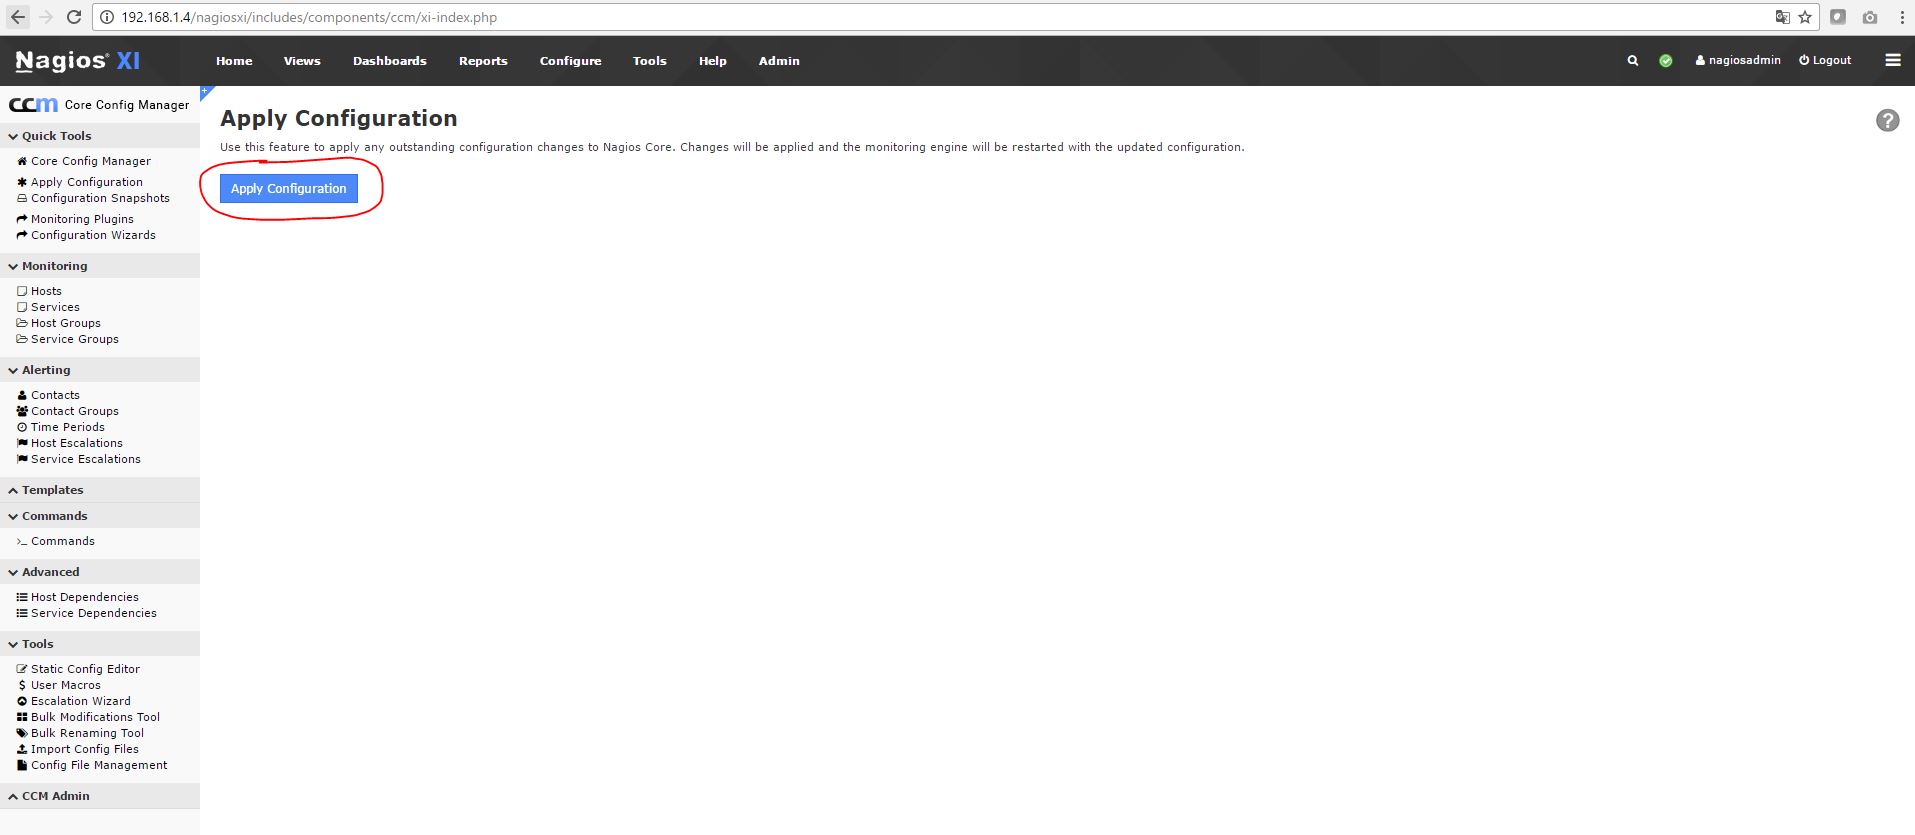
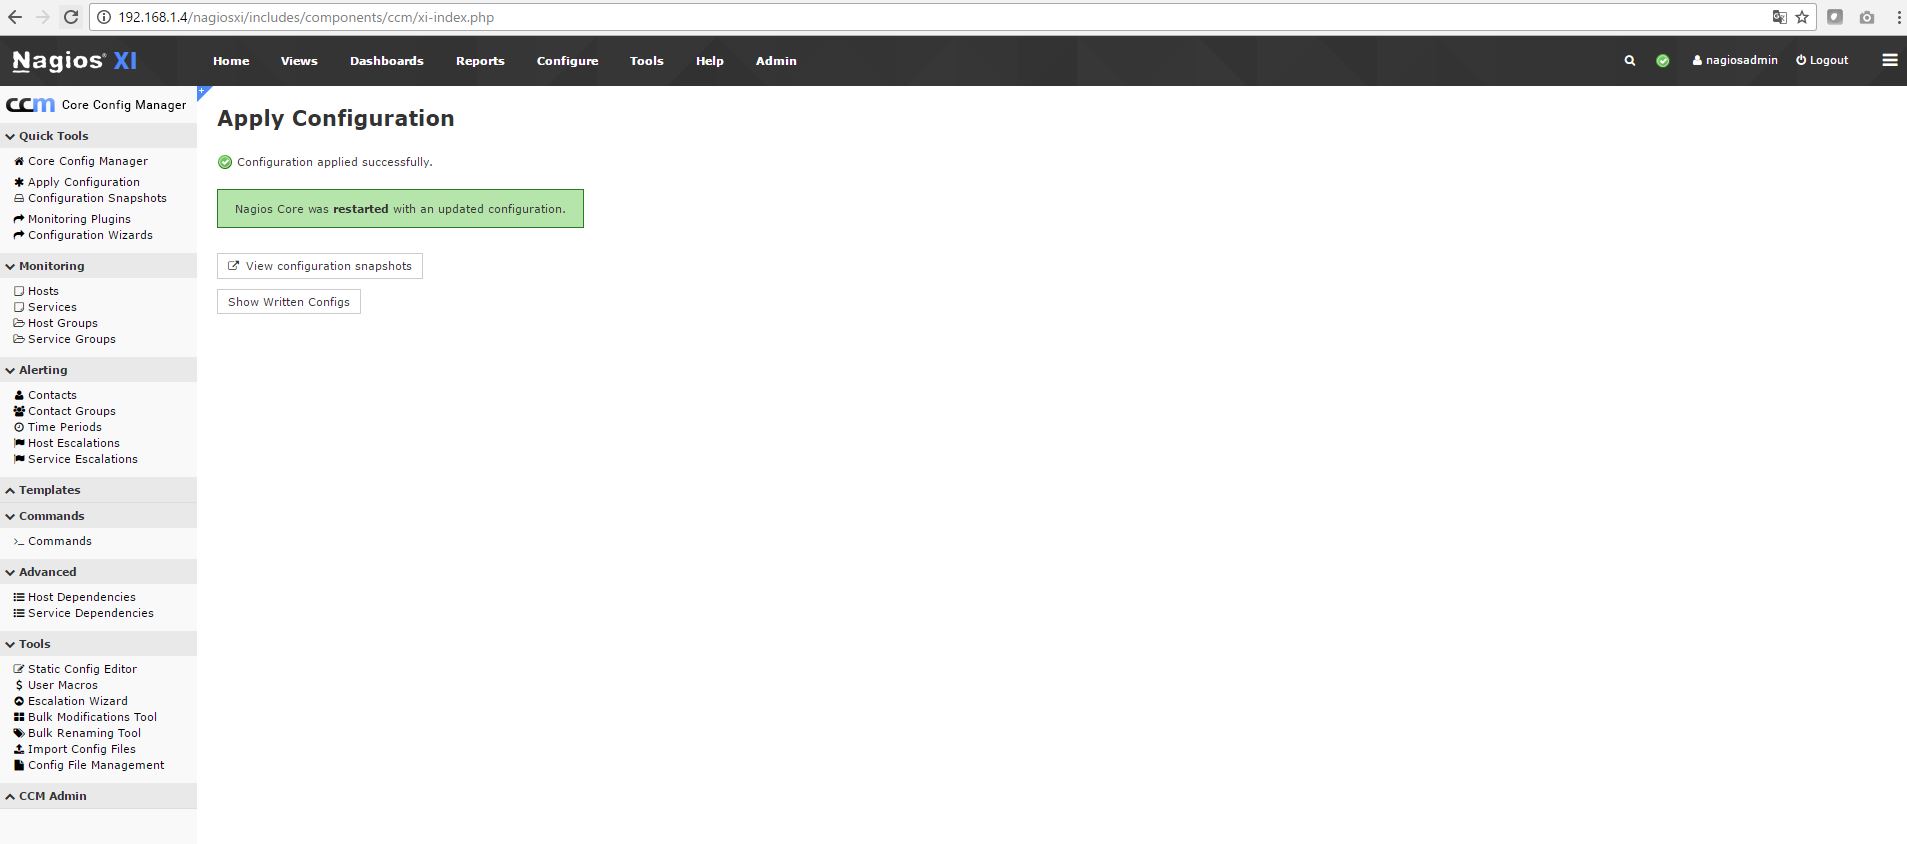
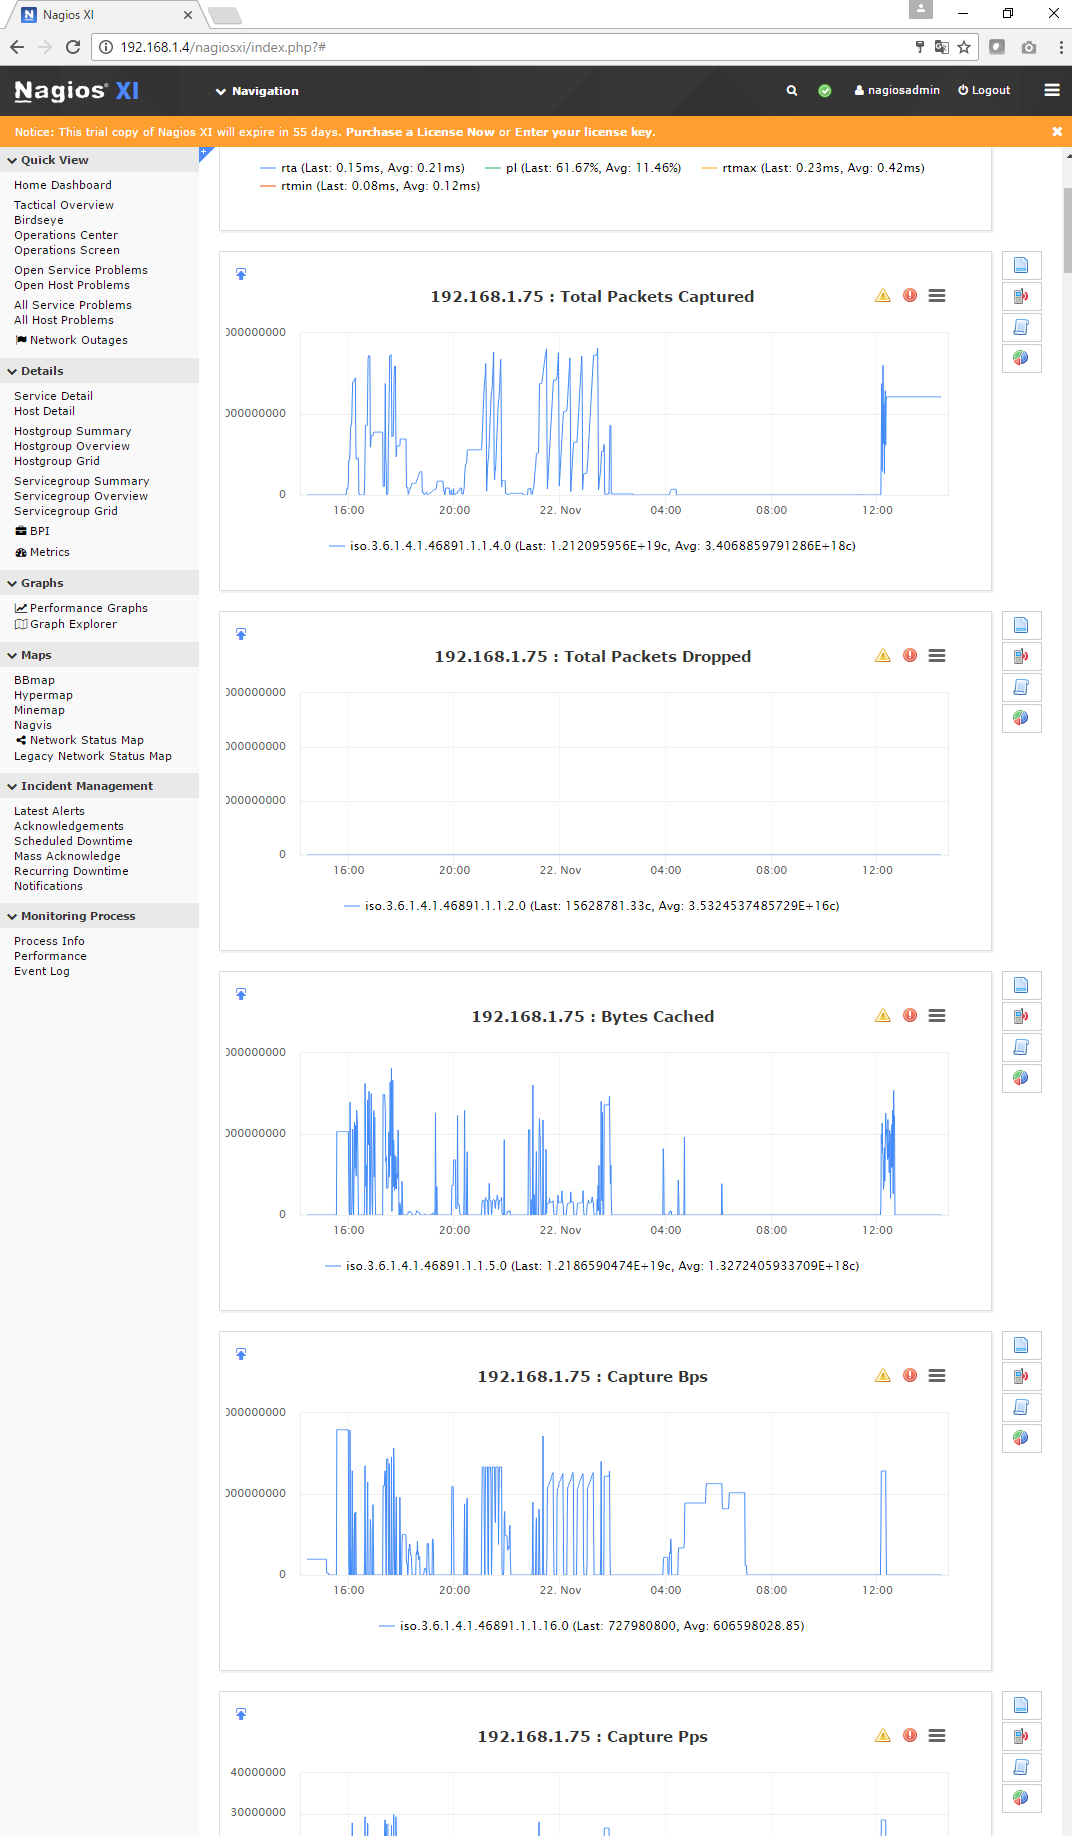
7) Nagios configuration is now complete.
Some examples shown below
Clock Synchronization
The FMADIO capture device has multiple time/clock synchronization methods. Please note, this setting is for synchronizing the local clock to World time (or a local Grand master). The hardware timestamp on every packet is always 1 nanosecond resolution.
| Protocol | Accuracy | Description |
| PTPv2 | < 100 nano seconds | Precision Time Protocol Version 2 |
| PTPv2 + PPS | < 10 nano seconds | Precision Time Protocol Version 2 With External PPS |
| GPS | < 10 nano seconds | Global Positioning System Time Synchronization (built in) |
| NTP | ~ 1,000,000 nano seconds | Network Time Protocol |
| NTP Manual | ~ 1,000,000 nano seconds | Manual Network Time Protocol Update |
Depending on operational conditions and requirements, please choose the best time synchronization option for your device.
PTPv2 Time Sync
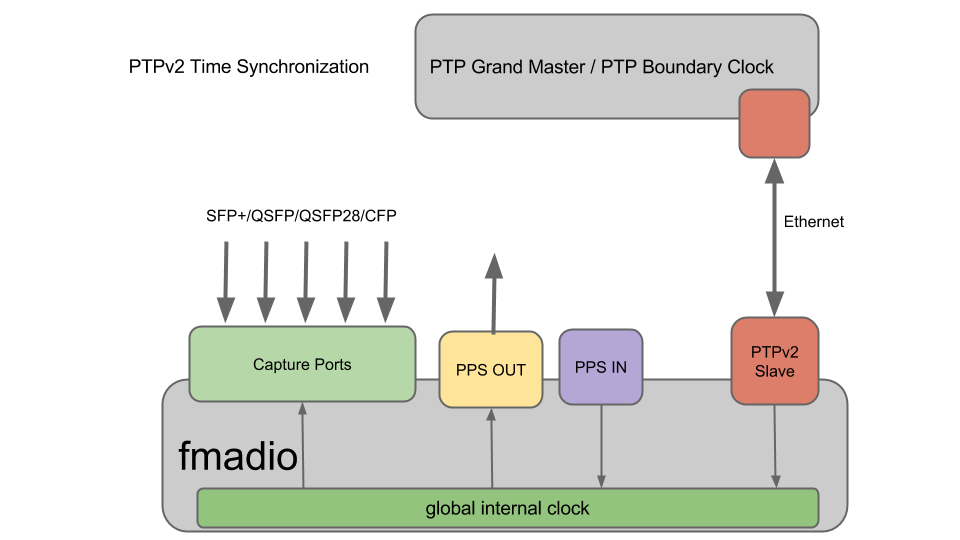
PTP Version 2 configuration provides the best accuracy that requires the least amount of setup/infrastructure. It does require a local PTP Grand master that is synchronized over ethernet. Typically we see 50-100ns accuracy using this method.
PTPv2 Time Sync + PPS Input
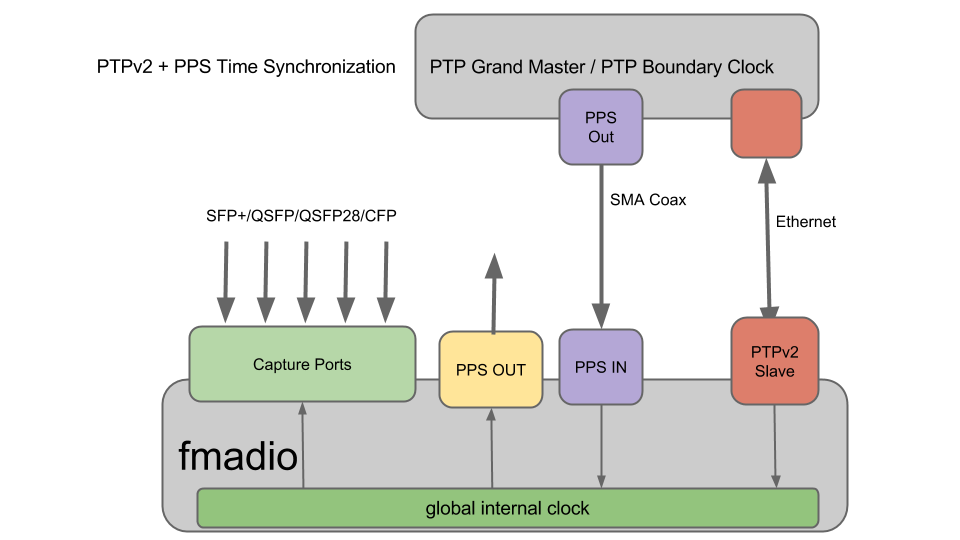
For applications requiring extreme timing accuracy this setup augments the PTPv2 synchronization with a 1PPS signal from the PTP GrandMaster/PTP Boundary switch. The additional PPS Input via the SMA coax cable provides 1 pulse per second timing accuracy to around 10nsec while the PTP protocol provides accurate date/time of day information.
GPS
Using the builtin GPS receiver with the included SMA cable provides excellent < 10nsec world time accuracy. It requires an active GPS antenna to be plugged in and connecting the GPS PPS Out port to the PPS In with the cable provided.
NTP
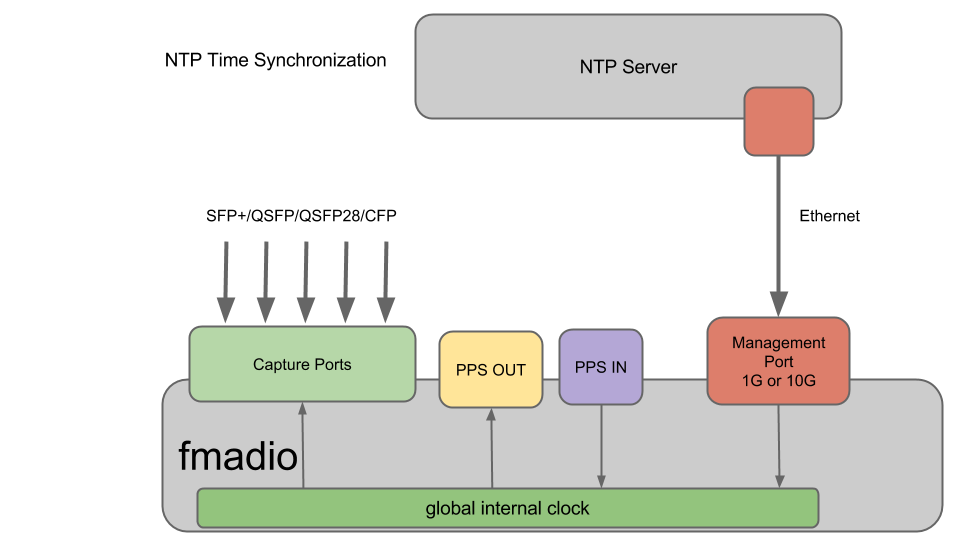
Network Time Protocol (NTP) is the most common and widely used time synchronization protocol. It requires an ethernet connection to the NTP time server, but the synchronization accuracy is not great, in 1-100 millisecond range.
SSH Shell Settings
FMADIO devices run exclusively from pseudo-ROM where any changes on the file system between reboots is lost. This ROM approach provides consistency and system predictability making maintenance simpler.
Shell Environment
One problem with this approach is shell customization becomes quite difficult. To allow small modifications in the shell environment when a user logs into the system it can run the shell script for each SSH session. Configuration file is:/mnt/store0/etc/fmadio.rc
Please do not use this excessively, typically its used for setting ENV variables.
Example:
$ cat /mnt/store0/etc/fmadio.rc
# local shell prompt configuration (ash) ran on at boot time

export TEST="random test variable"
authorized_keys
This file is usually located in ~/.ssh/ directory. As that is part of the volatile file system, the persistent version of this is placed into
/opt/fmadio/etc/authorized_keys
This allows SSH keys to be used in a persistent way across reboots and power cycles. Note the file in /opt/fmadio/etc/authorized_keys is only copied during bootup. Updates made after reboot are not copied to the user .ssh directory.
sshd_config
A customized sshd configuration file can be used by placing the customized configuration into
/opt/fmadio/etc/sshd_config
This is helpful for example to force exclusive RSA based login / disable password login. Which is a good practice if the device is on a public network.
System Configuration
Configuration Save
To save the global system configuration uses the command line utility system_config.lua The utility offers the following options
system_config.lua : save and restore system config
---------------------+----------------------------------------------
--save
To Save a configuration run as follows
fmadio@fmadio20-049$ system_config.lua  --save test1234
Save System Configuration
Cmd [sudo mkdir -p /opt/fmadio/etc/backup/]
Cmd [sudo find /opt/fmadio/etc/ -type f | grep -v backup > /tmp/config_backup.list]
sh: can't create /tmp/config_backup.list: Permission denied
Cmd [sudo tar hcfz /opt/fmadio/etc/backup/config_20170718_225310_test1234.tar.gz -T /tmp/config_backup.list]
Cmd [tar: removing leading '/' from member names]
Config Saved as [/opt/fmadio/etc/backup/config_20170718_225310_test1234.tar.gz]
fmadio@fmadio20-049$
This creates the backup file which may be copied off the box for remote storage
/opt/fmadio/etc/backup/config_20170718_225310_test1234.tar.gz
Configuration Restore
To restore a configuration file, start by listing the current backup configurations
fmadio@fmadio20-049$ system_config.lua  --list
List System Configuration
List [config_20170718_223801_factory]
List [config_20170718_225310_test1234]
fmadio@fmadio20-049$
In this case there are 2 backup configurations. This example will restore the "factory" config. To apply as follows
fmadio@fmadio20-049:$ system_config.lua  --restore config_20170718_223801_factory
fmad fmadlua Jul 18 2017
calibrating...
0 : 3499993134           3.5000 cycles/nsec offset:0.007 Mhz
Cycles/Sec 3499993134.0000 Std:       0 cycle std(  0.00000000) Target:3.50 Ghz
argv /opt/fmadio/bin/fmadiolua
argv config_20170718_223801_factory
loading filename [system_config.lua]
Restore System Configuration
Cmd [cd /; sudo tar xfzv /opt/fmadio/etc/backup/config_20170718_223801_factory.tar.gz]
Cmd [opt/fmadio/etc/60-persistent-ethernet.rules]
Cmd [opt/fmadio/etc/shadow-]
Cmd [opt/fmadio/etc/container.lua]
.
.
.
.
fmadio@fmadio20-049:$
And the system has restored the configuration.
Read Only Configuration
In some install locations disabling any configuration changes are required. For example if support staff are utilizing the device an accidental change to the configuration (e.g. stopping a capture or power off the device) could be problematic.
FMADIO devices can be put into a "READ ONLY" mode, where all configuration changes are denied. It requires changing a configuration file an a few linux CLI commands as shown below.
Step 1) Change configuration file
The configuration shown below is set to "full" access. See the "ConfigAccess" setting.
$ cat /mnt/store0/etc/time.lua
madio@fmadio20-049:~$ cat /opt/fmadio/etc/time.lua
-- autogenerated Tue Oct 17 02:37:55 2017 from fcgi handler
local Time=
{
["TZ"] =
{
    ["Offset"] = "+09:00",
    ["OffsetHour"] = 9,
    ["OffsetMin"] = 0,
    ["OffsetTS"] = 32400000000000,
    ["Name"] = "Asia/Tokyo",
    ["Abbr"] = "JST",
},
["Source"] = "none",
["NTP"] =
{
    ["Server0"] = "",
    ["Server1"] = "",
    ["Server2"] = "",
    ["Server3"] = "",
},
["PTP"] =
{
    ["Master0"] = "0.pool.ntp.org,
    ["Master1"] = "",
    ["Master2"] = "",
    ["Master3"] = "",
    ["UpdateRate"] = "15min",
    ["VLANID"] = "0",
},
["PPS"] =
{
    ["CableLength"] = "10",
},
["Security"] =
{
    ["HTTPAccess"] = "enable",
    ["LDAPAuth"] = "disable",
    ["ConfigAccess"] = "full",
    ["GUIMode"] = "full",
    ["EnableWebDAV"] = false,
},
["SNMP"] =
{
    ["ComName"] = "public",
},
["PCAP"] =
{
        ["TimeResolution"] = "nsec",
        ["TimeSortDepth"] = 256,
}
}
return Time
Change this to "readonly" as follows. NOTE: all punctuation must not be changed otherwise the configuration file can not be processed
["Security"] =
{
    ["HTTPAccess"] = "enable",
    ["LDAPAuth"] = "disable",
    ["ConfigAccess"] = "readonly",
    ["GUIMode"] = "full",
    ["EnableWebDAV"] = false,
},
Step 2) System Reboot
After the config has been updated a system reboot is required for the configuration to take effect.
Alternatively if a system reboot is not possible, you can manually restart the following processes for the new permissions to become activated
fmadio@fmadio20-049:~$ sudo killall www_fcgibackend
fmadio@fmadio20-049:~$ sudo killall stream_http
The system will take ~ 1 minute for the processes to respawn with the new configuration setting.
Step 3) Confirm READONLY mode
Check the GUI Config page, scrolling down to see the following setting. Note from the GUI the configuration can NOT be changed.
If a user attempts to change configuration, for example set the management IP to 192.168.1.1 the GUI will show a "permission denied" error message as shown below
Push Configuration
FMADIO Packet Capture systems provide a built in Push mode to transfer capture PCAP data on a regular schedule to a remote system. An example is pushing 1minute PCAPs to a remote NFS share
Configuration is via configuration scripts located:
/opt/fmadio/etc/push_realtime.lua
An example is shown as follows:
fmadio@fmadio20v3-287:/opt/fmadio/etc$ cat push_realtime.lua
local Config = {}

Config.Target = {}

table.insert(Config.Target, { Desc = "pcap-all", Mode = "File", Path = "/mnt/remote0/push/",   Split="--split-time 60e9", FileName="--filename-epoch-sec-startend", FilterBPF=nil })

return Config

fmadio@fmadio20v3-287:/mnt/store0/etc$
Multiple push targets can be specified. In the above example all PCAP data is sent to the remote NFS share mounted on /mnt/remote0. See NFS mount configuration for details on setting up /mnt/remote0 mounting points.
Configuration options as follows
Desc
Text field providing user information about the push target. Recommend no spaces or special characters.
Mode
- File : write a file (currently this is the only mode)
Path
Full remote path of the target PCAPs. This include any subdirectories within the NFS mount the PCAPs are to be written to
Split
What kind of split mode to apply:
--split-time (time in nanonseconds)       : the example is 1 minute (60e9 nanonseconds)

--split-byte (bytes)                      : the number of bytes to split by. scientific notation can be used (e.g 1e9 for  1GB)
FileName
Specifies how the split filename is encoded
--filename-epoch-sec-startend             : writes the sec epoch start/end time as the file name. (e.g. 1616334655-1616334755.pcap)

--filename-epoch-sec                      : writes the sec epoch start time as the file name. (e.g. 1616334655.pcap)

--filename-timestr-HHMM                   : writes the YYYYMMDD_HHMM style file name. (e.g. 2021 Dec 1st 23:50 20211201_2350.pcap)

--filename-timestr-HHMMSS                 : writes the YYYYMMDD_HHMMSS style file name. (e.g. 2021 Dec 1st 23:50:59 20211201_235059.pcap)

--filename-timestr-HHMMSS_NS              : writes the YYYYMMDD_HHMMSS.MSEC.USEC.NSEC style file name. (e.g. 2021 Dec 1st 23:50:59 123456789nsec 20211201_235059.123.456.789.pcap)
FilterBPF
Full libpcap BPF filter can be applied to reduce the total PCAP size. Example might be
"tcp"
to write TCP only traffic. A more likely example is to exclude backup traffic from specific ip
"not host 192.168.1.100"
Analytics Configuration
In addition to /opt/fmadio/etc/push_realtime.lua Analytics scheduler must be set to start the push operation. Configuration must be set as follows

Currently it only pushes the currently active capture.
Inline Packet Capture
FMADIO Gen2 packet capture systems support Inline 10G full duplex (20 Gbps) Packet capture. This enables quick and easy capture of data on the wire without complicated Optical TAPs or Switch SPAN/Mirror ports. The downside is this adds additional infrastructure risk due to the active components on the link. Because of this additional risk we have provide more detail on how the inline capture operates.
FMADIO Gen2 inline mode operates entirely at the Layer 1 XGMII level, there is no MAC involved and all forwarding is performed entirely on-chip in the FPGA. Additional latency added to the link is under 1 microsecond. The figure below shows the logical topology of the inline capture.
As shown above forwarding is performed at the eletrical Layer 1 level entirely on the FPGA itself (no SW or offchip memory involved). As this is Layer 1 forwarding, in network terminiology it is cut-thru forwarding 100% of the time.
Please note forwarding is stopped durning reboot and power cycle of the capture system. We are working to target downtime to under 100 milliseconds (currently it is 1 - 90 secconds). Because of potential downtime, its expected Inline mode is only used for temporary troubleshooting.
Once Inline Mode is activated, forwarding is always performed regardless of the capture enable/disable status. e.g packets remain forwarding until the system is shutdown or rebooted.
Finally Full 2 x 10G packet capture is performed as normal, inline mode is completely independent and has no impact on the capture performance. At the higher level shown below you can see how capturing a full duplex 10G link is achveived, its simple, quick to setup and gaurenteed to no drop any packets.
To enable Inline capture mode
1) Stop any currently active captures
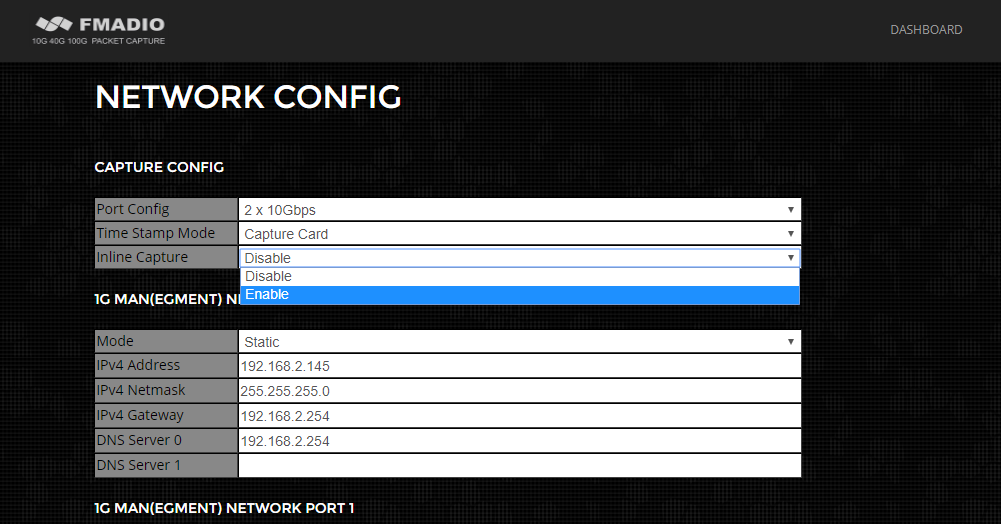
2) Selected from the config menu as shown below.
3) Start a new catpure and inline mode will activate
Flush to Disk
Gen2+ Only
FMADIO Packet Capture systems like all capture systems have multiple internal buffers. These internal buffers can sometimes cause problems for low bandwidth connections which requires Packets to be available on disk immediately for downstream processing.
One such example is Financial Order and Entry data, which can sometimes be extremely low bandwidth however downstream systems require packets to be available ASAP for further processing.
FMADIO Gen2 systems buffer between 2MB-4MB of data internally. To support multiple use cases the flushing mechanics can be tuned based on the customers requirements. By default the flushing occurs when there is no new packets in the last 1 second.
Configuration
Please edit the configuration file in
/opt/fmadio/etc/time.lua
The relevant sections are
["Capture"] =
{
        ["Inline"]      = false,
        ["PortMode"]    = "2x10G",
        ["FlushPktCnt"] = 2000,
        ["FlushPeriod"] = 0,
        ["FlushIdle"]   = 1e9,
}
If these options are not visible in the config file, please go to the GUI Config page, change the PCAP Time Resolution to Micro Second, then back to Nano Second. This will write the default values into the config file. Alternatively you can paste the missing lines from the above example.
NOTE: After changing the settings capture must be stopped, and restarted for the new settings to take effect
FlushPktCnt
Flushing works by injecting specially marked NOP packets into the system right at the capture port. Its as if the packets arrived on the ingress port, but are never visible or downloadable. This parameter sets the number of packets for each flush per port to be injected. The packets are 256B in length.
Default value is: 2000 pkts * 256B = 512,000 bytes per port.
For usage models where quick Flush to disk is critical, its recommended to use 5,000 or 10,000 packets for a complete flush. Note this will directly effect how much storage is consumed by the flushing behavior
FlushPeriod
Flushing based on a pre-defined time interval. For example flush the entire pipeline every 1 minute regardless of how much data has been seen. For a 1 minute flush, the value here should be 60e9, scientific notation is accepted and the unit of time is nano seconds.
Default value is: 0 - this disables the periodic flushing
Lowest recommended setting is 1 minute, otherwise excessive flushing will consume disk space.
FlushIdle
Flushing based on an in-activity idle timeout. This will flush the pipeline if no new packets are received within X amount of time. For example the default setting is 1 second, if no new packets are received after 1 second a SINGLE pipeline flush is issued. The next pipeline flush will only occur if new packets are received.
Default value is: 1e9 - flush after 1 second of inactivity, value in nano seconds
To disable set to 0
This mode is the default configuration
Recommended Settings
For Financial customers the following setting is recommended
        ["FlushPktCnt"] = 5000,
        ["FlushPeriod"] = 60e9,
        ["FlushIdle"]   = 0,
This will flush both ports every 1 minute continuously.
1 Hour / 1 Min = 60 flushes
1 Flush 2 x 5000 packets * 256 Bytes = 2,560,000 Bytes per flush
Total of extra 153MB per hour for the continuous flushing. or 1.2GB for 8 Hours is fairly reasonable.
Automatic NFS Mounts
Mounting a remote NFS file system on the FMADIO capture device can be extremely useful in many cases. It provides a simple way to process PCAPs on the Capture Device then writing the results out to a remove storage system.
An example is generating IPFIX Netflows via YAF and storing the result on the remote (usually very large) storage.
NFS Config
Please edit the configuration file in
/opt/fmadio/etc/disk.lua
Create an entry named "NFSDisk" as shown below, be careful all punctuation is correct.
["192.168.2.131:/home"] = "remote0",
Mount options can be specified after a : e.g. to mount using NFSv3
["192.168.2.131:/home"] = "remote0:"-o vers=3 -o nolock",
Full example of a disk configuration file
return
{
    CacheDisk =
    {
        ["S3EWNX0K116564W"] = "ssd0",
        ["S3EWNX0K116582F"] = "ssd1",
        ["S3EWNX0K116574D"] = "ssd2",
        ["S3EWNX0K116592K"] = "ssd3",
    }
    ,
    RaidDisk =
    {
        ["6522KJS3FSAA"] = "hdd0",
        ["25Q8K2SXFSAA"] = "hdd1",
        ["357FK7NVFSAA"] = "hdd2",
    }
    ,
    ParDisk =
    {
        ["16PFKD4QFSAA"] = "par0",
    },
    OSDisk =
    {
        ["D8E107781F8400012443"] = "os0",
    }
    ,
    ["NFSDisk"] =
    {
        ["192.168.2.131:/home"] = "remote0",
    }
    ,
    IndexDisk = "ssd",
    CacheLevel = "full",
    RaidLevel = "raid0",
}
After the configuration file is setup, reboot the system and the NFS mount point will automatically mount at boot time.
This example will mount an NFS Share named /home on the server 192.168.2.131, mounting it on the local file system as /mnt/remote0/
The mount point must remain the same (remote0, remote1, remote2) however you can change the remote server IP/Path to anything.
Users and Passwords
WebGUI
FMADIO Packet Capture Systems use the default login and password when the system is shipped. Additional WebGUI users can be added manually using the htpasswd utility. To set a new password "password" for the fmadio account use the following command line:
fmadio@fmadio20v2-149:$ sudo htpasswd /opt/fmadio/etc/htpasswd fmadio password
By default this utility overwrites the existing user account, so only 1 user account is possible. However additional users are added by appending to the /opt/fmadio/etc/htpasswd file. The following shows creating a user account "test" with the password "newpassword".
fmadio@fmadio20v2-149:$ sudo htpasswd /tmp/ptmp test newpassword
fmadio@fmadio20v2-149:$ cat /tmp/ptmp >> /opt/fmadio/etc/htpasswd
Please be careful duplicate usernames are not in the /opt/fmadio/etc/htpasswd file. Use a text editor to adjust the file if needed.
The new users and passwords can now access the GUI. In addition for logging the nginx access logs will show the username for all URL requests.
SSH
Unfortunately adding additional SSH usernames is not possible, as the permissions may be incorrectly set causing undefined system behavior. However multiple people can login to the system using different SSH keys via the .authorized_keys config file.
The authorized ssh keys file is located in
/opt/fmadio/etc/fmadio_authorized_keys
Please note, the authorized_keys file in the users .ssh account directory does not persist across reboots. Keys must be added to the above location.
LDAP Authentication
Login authentication for multiple users can be problematic in large organizations. As such FMADIO packet capture systems can use the nginx-auth-ldap module to authenticate users.
GitHub repo: https://github.com/kvspb/nginx-auth-ldap
Its fairly simple to setup, most of the problems are finding the exact LDAP DN to query your OpenLDAP server or Active Directory server.
LDAP Config
1) Enable LDAP authentication.
This can only be done via SSH shell and config file editing. The config file to edit is:
/opt/fmadio/etc/time.lua
Under Security table, set "LDAPAuth" to "enable", as shown below
["Security"] =
{
    ["HTTPAccess"] = "enable",
    ["LDAPAuth"] = "enable",
    ["ConfigAccess"] = "full",
    ["GUIMode"] = "full",
    ["EnableWebDAV"] = false,
},
Save the configuration file.
2) Configure the LDAP DN search
Next create the nginx-auth-ldap configuration file in
/opt/fmadio/etc/ldap_nginx.conf
This is where the LDAP configuration specific for your organization is set. An example file is ldap_nginx.conf and shown below.
Two LDAP servers are required in the config. If only 1 server is available, you can duplicate it as shown below.
ldap_server ldap_server0 {
    url "ldap://192.168.2.115:389/DC=fmad,DC=com?uid?sub";
    binddn "CN=admin,DC=fmad,DC=com";
    binddn_passwd "mypassword";
    group_attribute uniquemember;
    group_attribute_is_dn on;
    require valid_user;
}
ldap_server ldap_server1 {
    url "ldap://192.168.2.115:389/DC=fmad,DC=com?uid?sub";
    binddn "CN=admin,DC=fmad,DC=com";
    binddn_passwd "mypassword";
    group_attribute uniquemember;
    group_attribute_is_dn on;
    require valid_user;
}
There is two components to this config file
a) LDAP admin bind account.
This is the admin account and password used to make LDAP requests for each user. The DN and Passwords will be unique for each organization
binddn "CN=admin,DC=fmad,DC=com";
binddn_passwd "mypassword";
b) LDAP User DN lookup
url "ldap://192.168.2.115:389/DC=fmad,DC=com?uid?sub";
The exact URL and DN/DC information is also unique for each organization. Will require assistance from your security / sysadmin personal to get the exact format correct.
3) Restart nginx by the following command lines
sudo killall setup_nginx.lua
sudo killall nginx
This will stop NGINX, system will re-start within 60 seconds or less. NGINX log files are in
/mnt/store0/log/nginx_error.log
Which can be very helpful to debug configuration settings
NOTE: you can repeat steps 2) and 3) many times until the LDAP config is running correctly.
4) Login to Web GUI
At this point you can login to the WebGUI using your LDAP uid and LDAP stored password.
IP/MAC on Capture Interface (Gen2 Only)
Background
By default FMADIO devices operate without any MAC or IP information. It receives and records any and all ethernet traffic on the wire. Its essentially a black hole high speed data recorder. However there are some situations where the Capture interfaces need an IP MAC address, this is for ERSPAN IP targets, and also having the capture ports directly join Mulitcast groups. The Gen2 system operates using "Gratuitous ARP replies", which means it sends ARP broadcasts out periodically to inform all devices the capture ports IP/MAC information.
Config
To Configure IP/MAC information for the capture ports. edit the files below, by adding 2 new sections ["cap0"] and ["cap1"]
fmadio@fmadio20v2-149:~$ cat /opt/fmadio/etc/network.lua
-- auto generated on Wed Dec 26 20:13:20 2018
local Config =
{
.
.
.
.
.

["cap0"] =
{
      ["MAC"]     = "00:11:22:33:44:55",
      ["Address"] = "192.168.10.1",
},
["cap1"] =
{
      ["MAC"]     = "00:66:77:88:99:aa",
      ["Address"] = "192.168.10.2",
},

}
return Config
By adding the cap0/cap1 entries and setting appropriate MAC/IP information the capture ports will now have valid MAC/IP information so other devices can now route to it.
To confirm the formatting of the file is correct run the following
fmadio@fmadio20v2-149:~$ luajit /opt/fmadio/etc/network.lua
fmadio@fmadio20v2-149:~$
If any error messages are seen then there is a formatting and punctuation errors, please check from the above carefully.
After confirming config file is error-free, please reboot the system for the new settings to be applied.
email system alerts
Background
Monitoring the health of the capture system can use SNMP or direct Email alerting. We prefer Email Alerts as many events specific to the capture system are not easily expressible via SNMP.
There are 2 broad alert types
- System Status
- Event has been triggered
System Status events are periodic alerts, for example Monday every week at 1:00 AM. The purpose of these alerts is to ensure the system is up, functioning correctly and alerts can be correctly sent. The key point is, a lack of system emails indicates a problem with the capture system, or email server or something inbetween. Its a type of low-frequency heart beat by the capture system.
Event trigger alerts. These are triggered on specific events such as
- Packet Capture Drops
- Packet Capture FCS Errors
- HW HDD/SSD Disk Errors
- Cache Overflows
- Disk Space low
Each of these triggers can be enabled/disabled individually.
Email Configuration
The first step is to configure and successfully send mails to the email server. We use MSMTP a light weight and fully capable email client. It requires a configuration file located int /opt/fmadio/etc/msmtp.rc
An example config using an encrypted TLS setting is shown below. Modify the settings for your environment.
Example Config
fmadio@fmadio20v2-149:~$ cat /opt/fmadio/etc/msmtp.rc

defaults
tls on
#tls_trust_file /etc/ssl/certs/ca-bundle.crt
tls_certcheck off
logfile /mnt/store0/log/msmtp.log
tls_starttls on

account default
host mail.fmad.com
port 587
auth on
user alert@fmad.io
password secret

fmadio@fmadio20v2-149:~$
Alert Configuration
The second step is configuring the alert system, the following is a standard configuration file
Example Config
fmadio@fmadio20v2-149:~$ cat /opt/fmadio/etc/alert.lua
local L =
{
["Email"] =
{
  Enable          = true,
  To              = "support@fmad.com",
  From            = "alert@fmad.com",
}
,
["HeartBeat"] =
{
  Enable          = true,
  WDay            = 0,       -- 0-Everyday, 1-Mon, 2-Tues, 3-Wed, 4-Thur, 5-Fri, 6-Sat, 7-Sun
  Hour            = 01,
  Min             = 00,
}
,
["AlertList"] =
{
  BytesOverflow   = true,    -- alert on cache bytes overflow
  PacketError     = true,    -- alert on Packet FCS errors
  PacketDrop      = true,    -- alert on capture system packet drops
  DiskFreeStore0  = 10e9,    -- alert on low disk space /mnt/store0/
  DiskFreeStore1  = 10e9,    -- alert on low disk space /mnt/store1/
  Sleep           = 60,      -- how long to sleep(in sec) when an alert is triggered. prevents flooding
}
}
return L
fmadio@fmadio20v2-149:~$
The above is fairly self explanatory, ["HeartBeat"] is the frequency of System status log files , where Hour is in 24H time.
Disk Encryption
On select models of FMADIO capture systems full disk encryption is available. When available it uses the SSD drivers controller firmware to provide AES256 encryption with the OPAL interface standard.
States of the system is as follows
Power Off:
All data is encrypted accessing requires a password
First Power On:
Drives are accessible but data remains encrypted
First Power On Unlock:
Each drive in the system is unlocked by a shared password. This allows the drives media to be written/read from
Warm Reboot:
After Unlock the drives remain unlocked
Power Off:
On power loss to the disks, all data becomes un-accessible and fully encrypted
Data is encrypted using AESS256 and a random key generated by the SSD Controller. The Password specified encrypts/decrypts this AES256 key allowing the controller to read/write from the media. This encryption key is only kept in volatile RAM, thus when power to the drive is removed, the encryption key is lost. Once the encryption key is gone all data on the storage media can not be read.
Drives can never be "bricked" as the drives can be reset by creating a new AES256 key. This reset however will remove all data previously written to the drive.
Drive Encryption Status
sudo disk_lock.lua --status
This Operation displays the drive encryption state, example as follows
fmadio@fmadio80v1-095:~$ sudo disk_lock.lua --status
[scr0    ] EncSupport:true EncEnabled:true EncSecurity:true DiskLocked:false MasterPWRev:2
[ssd0    ] EncSupport:true EncEnabled:true EncSecurity:true DiskLocked:false MasterPWRev:2
[ssd1    ] EncSupport:true EncEnabled:true EncSecurity:true DiskLocked:false MasterPWRev:2
[ssd2    ] EncSupport:true EncEnabled:true EncSecurity:true DiskLocked:false MasterPWRev:2
[ssd3    ] EncSupport:true EncEnabled:true EncSecurity:true DiskLocked:false MasterPWRev:2
[ssd4    ] EncSupport:true EncEnabled:true EncSecurity:true DiskLocked:false MasterPWRev:2
[ssd5    ] EncSupport:true EncEnabled:true EncSecurity:true DiskLocked:false MasterPWRev:2
[ssd6    ] EncSupport:true EncEnabled:true EncSecurity:true DiskLocked:false MasterPWRev:2
[ssd7    ] EncSupport:true EncEnabled:true EncSecurity:true DiskLocked:false MasterPWRev:2
[ssd8    ] EncSupport:true EncEnabled:true EncSecurity:true DiskLocked:false MasterPWRev:2
[ssd9    ] EncSupport:true EncEnabled:true EncSecurity:true DiskLocked:false MasterPWRev:2
[ssd10   ] EncSupport:true EncEnabled:true EncSecurity:true DiskLocked:false MasterPWRev:2
[ssd11   ] EncSupport:true EncEnabled:true EncSecurity:true DiskLocked:false MasterPWRev:2
[ssd12   ] EncSupport:true EncEnabled:true EncSecurity:true DiskLocked:false MasterPWRev:2
[ssd13   ] EncSupport:true EncEnabled:true EncSecurity:true DiskLocked:false MasterPWRev:2
[ssd14   ] EncSupport:true EncEnabled:true EncSecurity:true DiskLocked:false MasterPWRev:2
[ssd15   ] EncSupport:true EncEnabled:true EncSecurity:true DiskLocked:false MasterPWRev:2
[ssd16   ] EncSupport:true EncEnabled:true EncSecurity:true DiskLocked:false MasterPWRev:2
[ssd17   ] EncSupport:true EncEnabled:true EncSecurity:true DiskLocked:false MasterPWRev:2
[ssd18   ] EncSupport:true EncEnabled:true EncSecurity:true DiskLocked:false MasterPWRev:2
[ssd19   ] EncSupport:true EncEnabled:true EncSecurity:true DiskLocked:false MasterPWRev:2
[ssd20   ] EncSupport:true EncEnabled:true EncSecurity:true DiskLocked:false MasterPWRev:2
[ssd21   ] EncSupport:true EncEnabled:true EncSecurity:true DiskLocked:false MasterPWRev:2
[ssd22   ] EncSupport:true EncEnabled:true EncSecurity:true DiskLocked:false MasterPWRev:2
[ssd23   ] EncSupport:true EncEnabled:true EncSecurity:true DiskLocked:false MasterPWRev:2
[ssd24   ] EncSupport:true EncEnabled:true EncSecurity:true DiskLocked:false MasterPWRev:2
[ssd25   ] EncSupport:true EncEnabled:true EncSecurity:true DiskLocked:false MasterPWRev:2
[ssd26   ] EncSupport:true EncEnabled:true EncSecurity:true DiskLocked:false MasterPWRev:2
[ssd27   ] EncSupport:true EncEnabled:true EncSecurity:true DiskLocked:false MasterPWRev:2
[ssd28   ] EncSupport:true EncEnabled:true EncSecurity:true DiskLocked:false MasterPWRev:2
[ssd29   ] EncSupport:true EncEnabled:true EncSecurity:true DiskLocked:false MasterPWRev:2
[ssd30   ] EncSupport:true EncEnabled:true EncSecurity:true DiskLocked:false MasterPWRev:2
[ssd31   ] EncSupport:true EncEnabled:true EncSecurity:true DiskLocked:false MasterPWRev:2
[ssd32   ] EncSupport:true EncEnabled:true EncSecurity:true DiskLocked:false MasterPWRev:2
[ssd33   ] EncSupport:true EncEnabled:true EncSecurity:true DiskLocked:false MasterPWRev:2
[ssd34   ] EncSupport:true EncEnabled:true EncSecurity:true DiskLocked:false MasterPWRev:2
[ssd35   ] EncSupport:true EncEnabled:true EncSecurity:true DiskLocked:false MasterPWRev:2
[ssd36   ] EncSupport:true EncEnabled:true EncSecurity:true DiskLocked:false MasterPWRev:2
[ssd37   ] EncSupport:true EncEnabled:true EncSecurity:true DiskLocked:false MasterPWRev:2
[ssd38   ] EncSupport:true EncEnabled:true EncSecurity:true DiskLocked:false MasterPWRev:2
[ssd39   ] EncSupport:true EncEnabled:true EncSecurity:true DiskLocked:false MasterPWRev:2
[ssd40   ] EncSupport:true EncEnabled:true EncSecurity:true DiskLocked:false MasterPWRev:2
[ssd41   ] EncSupport:true EncEnabled:true EncSecurity:true DiskLocked:false MasterPWRev:2
[ssd42   ] EncSupport:true EncEnabled:true EncSecurity:true DiskLocked:false MasterPWRev:2
[ssd43   ] EncSupport:true EncEnabled:true EncSecurity:true DiskLocked:false MasterPWRev:2
[ssd44   ] EncSupport:true EncEnabled:true EncSecurity:true DiskLocked:false MasterPWRev:2
[ssd45   ] EncSupport:true EncEnabled:true EncSecurity:true DiskLocked:false MasterPWRev:2
fmadio@fmadio80v1-095:~$
Explanation of each field is as follows:
EncSupport: Shows if the drive supports full disk encryption
EncEnabled: Shows true/false if encryption is enabled on this drive
EncSecurity: Shows true/false if high security mode is enabled. This should always be TRUE otherwise the default master password can unlock the drive
DiskLocked: Shows true/false if the drives is currently locked or unlocked
MasterPWRev: Shows number of times the master (not user) password has been changed
Resetting Password / Format Wipe
sudo disk_lock.lua --reset
This sets a new encryption password on all the disks. It will also WIPE ALL DATA ON THE CURRENT DISK. Please ensure there is no critical data on the system before running this command. After the operation the disks are in an UNLOCKED state.
Unlocking Disks
sudo disk_lock.lua --unlock
Command will unlock and verify correct functionality of the disks. Starts by unlocking each disk using the supplied password, then reloading all storage components of the FMADIO system which reference the disks. Once complete it then runs a self verification test by writing a randomly seeded increasing sequence number to a small section of the storage reserved for verification (4GB or so) then reads back and verifies the sequence numbers match what was written. If the unlock was successful, an ALL PASS message is displayed. Any errors encountered will show a red failure message.
Index Utility
sudo disk_lock.lua --index
Helper utility that creates a RAID0 partition on /mnt/store1 such that the capture file index can reside there (instead of on the OS disk). Typically after this command is ran, an array format is issued to complete the process.
Packet Privacy
Full Packet Capture is excellent because it contains everything on the network, however in some organizations with strict privacy policies it creates problems with the compliance department. The problem is user sensitive data gets recorded onto the device and anyone who has access to the device can now read that sensitive data.
We support packet slicing on download as a way to solve the compliance problem. Administrators of the FMADIO Packet Capture system still have full access to all data recorded, however any Web/HTTP Users can only access the truncated headers only version of the data. In many cases header only data is enough to troubleshoot a problem.
To be clear, we have 2 types of packet slicing
Pre Capture Slicing:
Truncation is performed on the NIC/FPGA before packets are written to the storage
Download Slicing:
Full packet data is on the storage, all packets are sliced/truncated when a PCAP is pulled off the system.
This enables 2 modes of access, an administrator full payload data access and also a user level header only access. Only the administrator of the FMADIO box can change this mode.
To enable Download Slicing, the following steps
Step 1)
Edit the config file
/opt/fmadio/etc/time.lua
Step 2)
Set the Truncation amount by adding or editing the following line in the configuration file
["PCAP"] =
{
        ["TimeStampMode"] = "nic",
        ["TimeResolution"] = "nsec",
        ["TimeSortDepth"]  = 256,
        ["Decap"]          = false,
        ["Slice"]          = 72,
},
In the above example all packets are truncated to 72 bytes. This is typically enough for all Ethernet, IP, Tunnels and TCP/UDP header information. In some cases more or less data is required.
Step 3)
Reboot the system
OR
kill some process and wait for reswapn (about 1min) as shown below
$ sudo killall stream_http
$ sudo killall www_fcgibackend
Step 4)
Confirm the new packet slicing amount has been updated on the CONFIG tab in the GUI

NOTE: to DISABLE Download Slicing, set the slice amount to 0
Scheduled Reboot
Scheduled system reboots is good practice for system infrastructure, as it provides a clean system state / refresh on a regular interval such as late Sunday night. This can be achieved using a custom crontab.root configuration file.
Start by copying the current configuration file to the fmadio etc directory
cp /etc/crontab.root /opt/fmadio/etc/
Then edit the crontab file as such
fmadio@fmadio20v2-149:~$ cat /opt/fmadio/etc/crontab.root
* * * * * /opt/fmadio/bin/watchdog.lua --nocal >> /mnt/store0/log/watchdog.log
59 23 * * 0 /sbin/reboot
fmadio@fmadio20v2-149:~$
Alternatively a cold reboot is recommended for Gen1 capture systems
fmadio@fmadio20v2-149:~$ cat /opt/fmadio/etc/crontab.root
* * * * * /opt/fmadio/bin/watchdog.lua --nocal >> /mnt/store0/log/watchdog.log
59 23 * * 0 /opt/fmadio/bin/power_reboot.lua
fmadio@fmadio20v2-149:~$
The above example shows rebooting the system automatically at Sunday evening midnight. After the configuration has been edited a system reboot is required for the new settings to be used.
Remote SYSLOGD
In large server deployments using remote syslogd where syslog entries are written over UDP is quite helpful. This allows a central server to monitor a fleet of servers by receiving all log entries over the network. This is a standard linux feature set. FMADIO Packet Capture devices support this feature, as follows:
Requires FW:6761+
FMADIO20G Portable Gen2
FMADIO20G Gen3
FMADIO40G Gen3
FMADIO100G Gen2
Copy the default syslogd.conf to /opt/fmadio/etc/
sudo cp /etc/syslogd.conf /opt/fmadio/etc/
Then edit the file as follows, replacing the destination IP with configuration specific to your environment
fmadio@fmadio100v2-228:~$ cat /opt/fmadio/etc/syslogd.conf
# Log anything
*.*                                     /mnt/store0/log/messages

# remote log server
*.*                                    @192.168.1.100.
In the above example all syslog log entries are also written to a server at 192.168.1.100 over UDP on port 514. Its the standard syslogd from inted package additional customization can be done if required.
Example syslog output as floows
Aug 12 21:06:36 box local7.info fmadio: Capture   (Enb: 0 Pkt: 0 Drop: 0 FCSError: 0 CaptureRateRate 0.00000000 Gbps)
Aug 12 21:06:36 box local7.info fmadio: Mem       (0.00GB ECC 0) Writeback (0.00GB) Dropped (0.00GB)
Aug 12 21:06:46 box local7.info fmadio: Temp      (CPU0:33.00 CPU1:33.00 PCH:41.00 SYS:36.00 PER:24.00 NIC:57.00 AirIn:24.00 AirOut:0.00 Transciver:40.00 41.00)
Aug 12 21:06:46 box local7.info fmadio: Fan       (SYS0:13650 SYS1:13800 SYS2:13800 SYS3:13500 SYS4:13500 SYS5:13500 SYS6:13650 SYS7:13500)
Aug 12 21:06:46 box local7.info fmadio: Disk      OS (Temp:27 ERR: 0 ) SSD (Valid:1 1 1 0 Temp:33 33 32 0 ERR:0 0 0 0 ) HDD (Valid:1 1 1 1 Temp: 30 30 30 29 ERR: 0 0 0 0 )
Aug 12 21:06:46 box local7.info fmadio: Link      Capture (1 1 0 0 0 0 0 0 ) Man (1G 1 10G 0 )
Aug 12 21:06:46 box local7.info fmadio: DiskIO    (Rd:  0.00Gbps Wr:  0.00Gbps)
Event list
Detailed explanation on the event lists.
FMADIO Packet Capture devices use syslog or rsyslog for monitoring system status. It provides a simple and robust way for monitoring system to check the health and status of the capture system. Below is documentation on the FMADIO20 Gen2/Gen3 and FMADIO40 Gen2/Gen3 syslog output
All events are logged under "local7.XXXXX fmadio" where XXX described the event type (info, notice, error, crit). This provides a clean way to attribute events to the capture system
Aug 12 21:06:36 box local7.info fmadio: Capture (Enb: 0 Pkt: 0 Drop: 0 FCSError: 0 CaptureRateRate 0.00000000 Gbps)
Example of a full status, system outputs this approximately every 10 seconds.
Aug 12 21:06:36 box local7.info fmadio: Capture   (Enb: 1 Pkt: 0 Drop: 0 FCSError: 0) CaptureRateRate 0.00000000 Gbps CaptureName: (test64_20200812_2212)
Aug 12 21:06:36 box local7.info fmadio: Mem       (0.00GB ECC 0) Writeback (0.00GB) Dropped (0.00GB)
Aug 12 21:06:46 box local7.info fmadio: Temp      (CPU0:33.00 CPU1:33.00 PCH:41.00 SYS:36.00 PER:24.00 NIC:57.00 AirIn:24.00 AirOut:0.00 Transciver:40.00 41.00)
Aug 12 21:06:46 box local7.info fmadio: Fan       (SYS0:13650 SYS1:13800 SYS2:13800 SYS3:13500 SYS4:13500 SYS5:13500 SYS6:13650 SYS7:13500)
Aug 12 21:06:46 box local7.info fmadio: Disk      OS (Temp:27 ERR: 0 ) SSD (Valid:1 1 1 0 Temp:33 33 32 0 ERR:0 0 0 0 ) HDD (Valid:1 1 1 1 Temp: 30 30 30 29 ERR: 0 0 0 0 )
Aug 12 21:06:46 box local7.info fmadio: Link      Capture (1 1 0 0 0 0 0 0 ) Man (1G 1 10G 0 )
Aug 12 21:06:46 box local7.info fmadio: DiskIO    (Rd:  0.00Gbps Wr:  0.00Gbps)
Events 20G/40G Platform
Firmware Version: 6638+
Platforms:
- fmadio20v2
- fmadio20v3
- fmadio40v2
- fmadio40v3
local7.info : Capture Status
Describes current state of capture
Capture (Enb: 1 Pkt: 0 Drop: 0 FCSError: 0) CaptureRateRate 0.00000000 Gbps CaptureName: (test64_20200812_2212)
Description
Enb: 1
- Current capture enable/disable status
0 - Capture is not running
1 - Capture is running


Pkt: 0
- Total number of packets captured


Drop: 0
- Total number of packets dropped


FCSError: 0
- Total number of FCS errors


CaptureRateRate 0.00000000 Gbps
- Currently active capture rate


CaptureName: (test64_20200812_2212)
- If capture is enabled displays the currently active capture name
local7.info : Memory/Data Status
Describes current memory / data status of the system
Mem (0.00GB ECC 0) Writeback (0.00GB) Dropped (0.00GB)
Description
(0.00GB ECC 0)
- Total Linux system memory free
- Total number of RAM ECC errors found


Writeback (0.00GB)
- Total bytes pending writeback from SSD Cache to HDD Storage

Dropped (0.00GB)
- Total bytes of data during SSD Cache writeback to HDD Storage
local7.info : Temperature Status
Shows the current thermal status of each component
Temp (CPU0:33.00 CPU1:33.00 PCH:41.00 SYS:36.00 PER:24.00 NIC:57.00 AirIn:24.00 AirOut:0.00 Transciver:40.00 41.00)
Description
CPU0:33.00
- Temperature of CPU Socket 0


CPU1:33.00
- Temperature of CPU Socket 1


PCH:41.00
- Temperature of PCH / Chipset


SYS:36.00
- General System Temperature


PER:24.00
- Perifial Temperature


NIC:57.00
- FPGA NIC Temperature


AirIn:24.00
- Air Intake Temperature

AirOut:0.00
- Air exhaust Temperature


Transciver:40.00 41.00)
- SFP/QSFP Transciver temperature
local7.info : Fan Status
Status of the server fans
Fan (SYS0:13650 SYS1:13800 SYS2:13800 SYS3:13500 SYS4:13500 SYS5:13500 SYS6:13650 SYS7:13500)
Description
SYS0:13650
- System Fan RPM 1A + 1B


SYS1:13800
- System Fan RPM 2A + 2B


SYS2:13800
- System Fan RPM 3A + 3B


SYS3:13500
- System Fan RPM 4A + 4B


SYS4:13500
- System Fan RPM 5A + 5B


SYS5:13500
- System Fan RPM 6A + 6B


SYS6:13650
- System Fan RPM 7A + 7B


SYS7:13500)
- System Fan RPM 8A + 8B
local7.info : Disk Status
Information of SSD and HDD disks on the system
Disk OS (Temp:27 ERR: 0 ) SSD (Valid:1 1 1 0 Temp:33 33 32 0 ERR:0 0 0 0 ) HDD (Valid:1 1 1 1 Temp: 30 30 30 29 ERR: 0 0 0 0 )
Description
OS (Temp:27 ERR: 0 )
- OS Disk Temperature and total SMART Errors


SSD (Valid:1 1 1 0 Temp:33 33 32 0 ERR:0 0 0 0 )
- SSD Valid ( 0 - Disk missing, 1 - Disk is active)
- SSD Temperature in C
- SSD SMART errors


HDD (Valid:1 1 1 1 Temp: 30 30 30 29 ERR: 0 0 0 0 )
- HDD Valid ( 0 - Disk missing, 1 - Disk is active)
- HDD Temperature in C
- HDD SMART errors
local7.info : Network Link Status
Shows the Link status of each network port on the device
Link Capture (1 1 0 0 0 0 0 0 ) Man (1G 1 10G 0 )
Description
Capture (1 1 0 0 0 0 0 0 )
- Link status of each capture port
- 0 : link down
- 1 : link up
(NOTE: depending on the FMADIO device there may be 2 to 8 physical capture ports)


Man (1G 1 10G 0 )
- 1G: Link status of the 1G RJ45 management port
      0 - Link down
      1 - Link up

- 10G: Link status of the SFP/QSFP 10G/40G high speed management port
      0 - Link down
      1 - Link up
local7.info : Disk IO Activity
Shows the current Disk IO activity
DiskIO (Rd: 0.00Gbps Wr: 0.00Gbps)
Description
(Rd:  0.00Gbps Wr:  0.00Gbps)
- Read and Write bandwidth to SSD or HDD
LACP Link Bonding
LACP or Link Bonding is critical for fail over / redundancy planning. FMADIO Packet Capture devices run on Linux thus we support LCAP/Bonding on the management interfaces.
Requires FW:6508+
/opt/fmadio/etc/network.lua
Add a bonded interface as follows
fmadio@fmadio20v3-287:/mnt/store0/etc$ cat network.lua
local Config =
{
["bond0"] =
{
    ["Mode"]    = "bond",
    ["Address"] = "192.168.1.2",
    ["Netmask"] = "255.255.255.0",
    ["Gateway"] = "192.168.1.1",
    ["DNS0"]    = "",
    ["DNS1"]    = "",
    ["Speed"]   = "10g",
    ["TSMode"]  = "nic",
    ["Slave"]  = { "phy0", "phy1" }
},
["bmc"] =
{
    ["Mode"]    = "static",
    ["Address"] = "192.168.1.93",
    ["Netmask"] = "255.255.255.0",
    ["Gateway"] = "192.168.1.1",
    ["DNS0"]    = "",
    ["DNS1"]    = "",
    ["Speed"]   = "10g",
    ["TSMode"]  = "nic",
}
}
return Config
fmadio@fmadio20v3-287:/mnt/store0/etc$
In the above example the "Slave" field contains the list of physical interfaces the bonding runs on. This example is bonding the two 1G RJ45 interfaces on the system. To bond the 10G interfaces on a separate LCAP link (bond1), use the following:
["bond1"] =
{
    ["Mode"]    = "bond",
    ["Address"] = "192.168.1.2",
    ["Netmask"] = "255.255.255.0",
    ["Gateway"] = "192.168.1.1",
    ["DNS0"]    = "",
    ["DNS1"]    = "",
    ["Speed"]   = "10g",
    ["TSMode"]  = "nic",
    ["Slave"]  = { "phy10", "phy11" }
},
LACP Bonding Mode
Requires FW: 6633+
By default 802.3ad bonding mode is used, full list of Linux bonding modes can be seen on kernel.org. Note "BondMode" specifies the Linux bonding mode to be used.
["bond1"] =
{
    ["Mode"]    = "bond",
    ["BondMode"] = "active-backup",
    ["Address"] = "192.168.1.2",
    ["Netmask"] = "255.255.255.0",
    ["Gateway"] = "192.168.1.1",
    ["DNS0"]    = "",
    ["DNS1"]    = "",
    ["Speed"]   = "10g",
    ["TSMode"]  = "nic",
    ["Slave"]  = { "phy10", "phy11" }
},
Line Bonding mode options
(ripped from kernel.org)
Round-robin (balance-rr)
Transmit network packets in sequential order from the first available network interface (NIC) slave through the last. This mode provides load balancing and fault tolerance.
Active-backup (active-backup)
Only one NIC slave in the bond is active. A different slave becomes active if, and only if, the active slave fails. The single logical bonded interface's MAC address is externally visible on only one NIC (port) to avoid distortion in the network switch. This mode provides fault tolerance.
XOR (balance-xor)
Transmit network packets based on a hash of the packet's source and destination. The default algorithm only considers MAC addresses (layer2). Newer versions allow selection of additional policies based on IP addresses (layer2+3) and TCP/UDP port numbers (layer3+4). This selects the same NIC slave for each destination MAC address, IP address, or IP address and port combination, respectively. This mode provides load balancing and fault tolerance.
Broadcast (broadcast)
Transmit network packets on all slave network interfaces. This mode provides fault tolerance.
Default mode
IEEE 802.3ad Dynamic link aggregation (802.3ad, LACP)
Creates aggregation groups that share the same speed and duplex settings. Utilizes all slave network interfaces in the active aggregator group according to the 802.3ad specification. This mode is similar to the XOR mode above and supports the same balancing policies. The link is set up dynamically between two LACP-supporting peers.
Adaptive transmit load balancing (balance-tlb)
Linux bonding driver mode that does not require any special network-switch support. The outgoing network packet traffic is distributed according to the current load (computed relative to the speed) on each network interface slave. Incoming traffic is received by one currently designated slave network interface. If this receiving slave fails, another slave takes over the MAC address of the failed receiving slave.
Adaptive load balancing (balance-alb)
includes balance-tlb plus receive load balancing (rlb) for IPV4 traffic, and does not require any special network switch support. The receive load balancing is achieved by ARP negotiation. The bonding driver intercepts the ARP Replies sent by the local system on their way out and overwrites the source hardware address with the unique hardware address of one of the NIC slaves in the single logical bonded interface such that different network-peers use different MAC addresses for their network packet traffic.
NOTE: PTPv2 and LCAP on the 10G Management interfaces are mutually exclusive.
Capture Start&Stop (Web)
Starting a capture manually can be performed using the Web interface or via Command Line Interface(CLI) from a remote machine. In most cases captures are started using the Scheduled Captures feature however there are many cases when starting an immediate capture is required.
Web Interface: Start Capture
From the dashboard Start by selecting the Capture menu option as highlighted in green below.
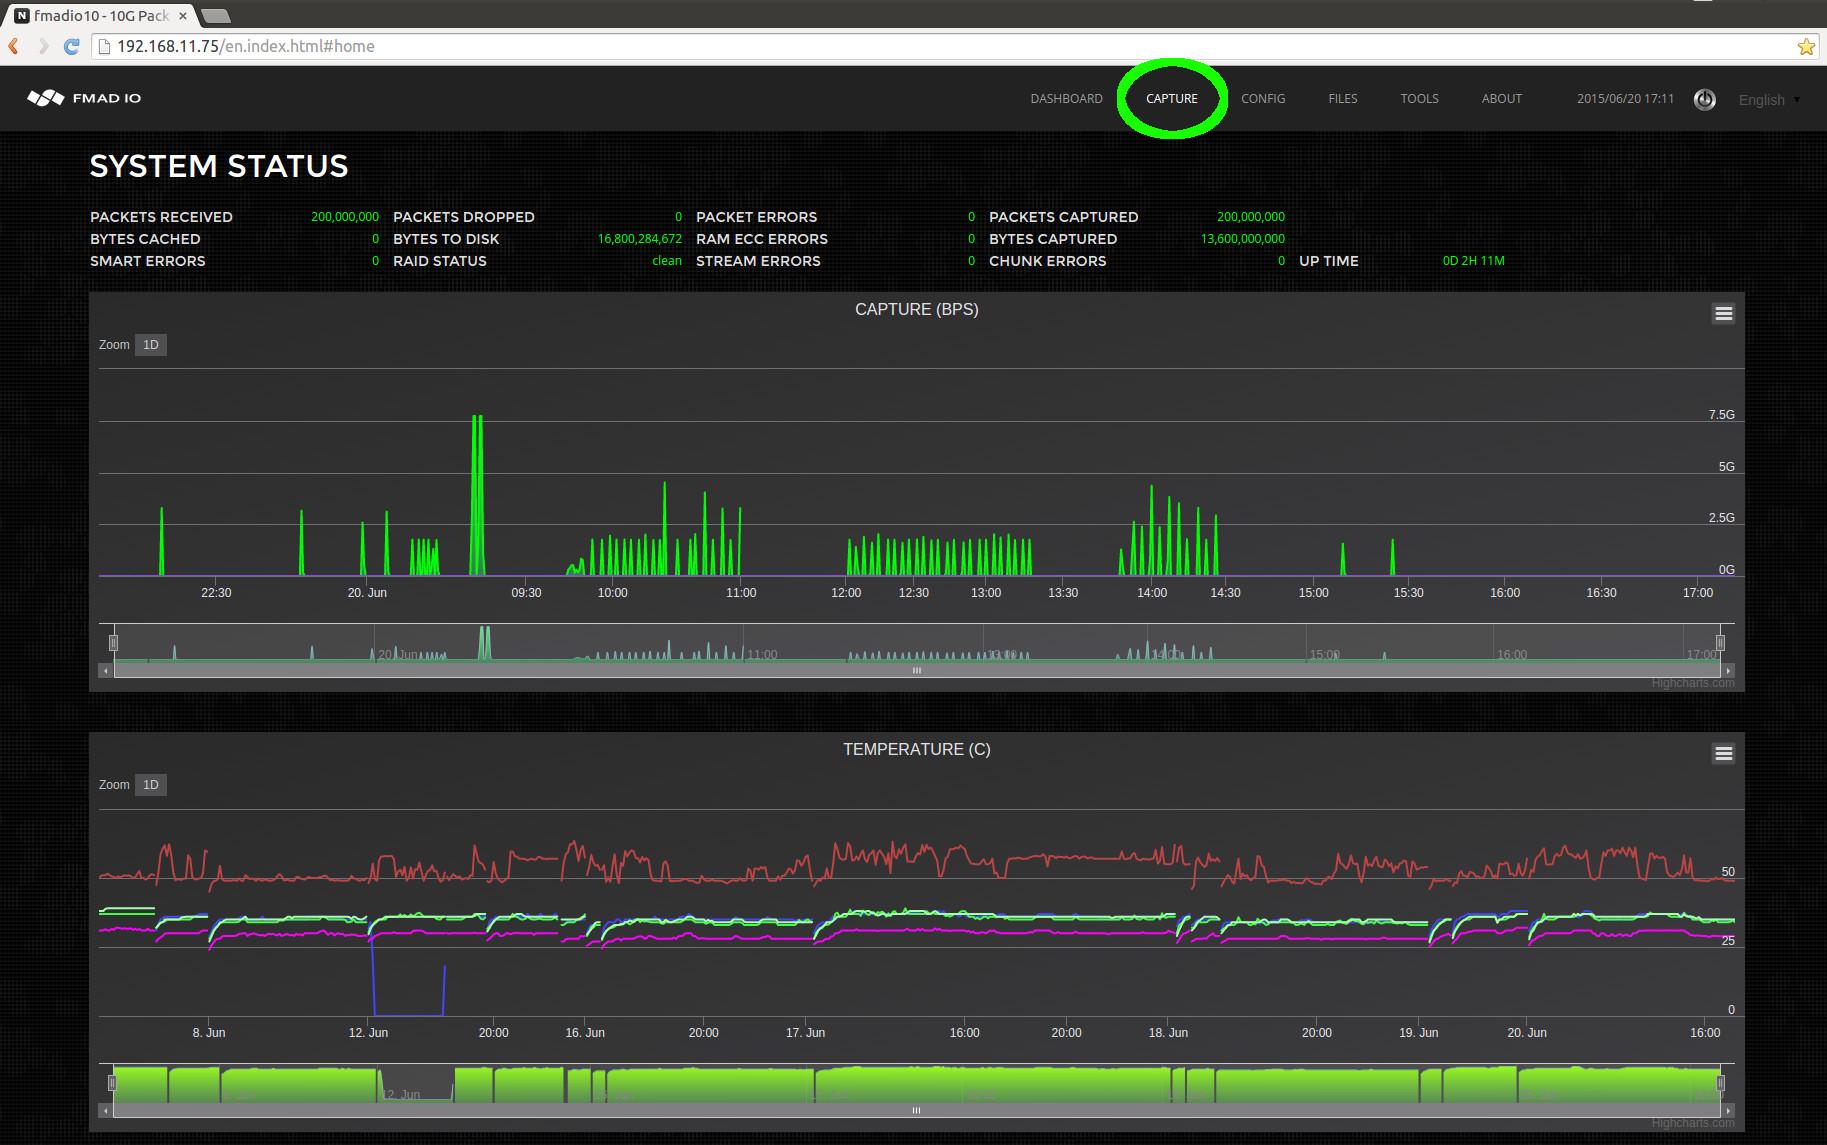
From the capture page below we can see there is no capture running (highlighted in green below).
The steps to start a capture immediately:
- 1) Enter a new capture name, in this example we enter "manual_capture" (highlighted in blue below)
- 2) Start the capture by clicking on the Rec(ord) button (highlighted in red below)
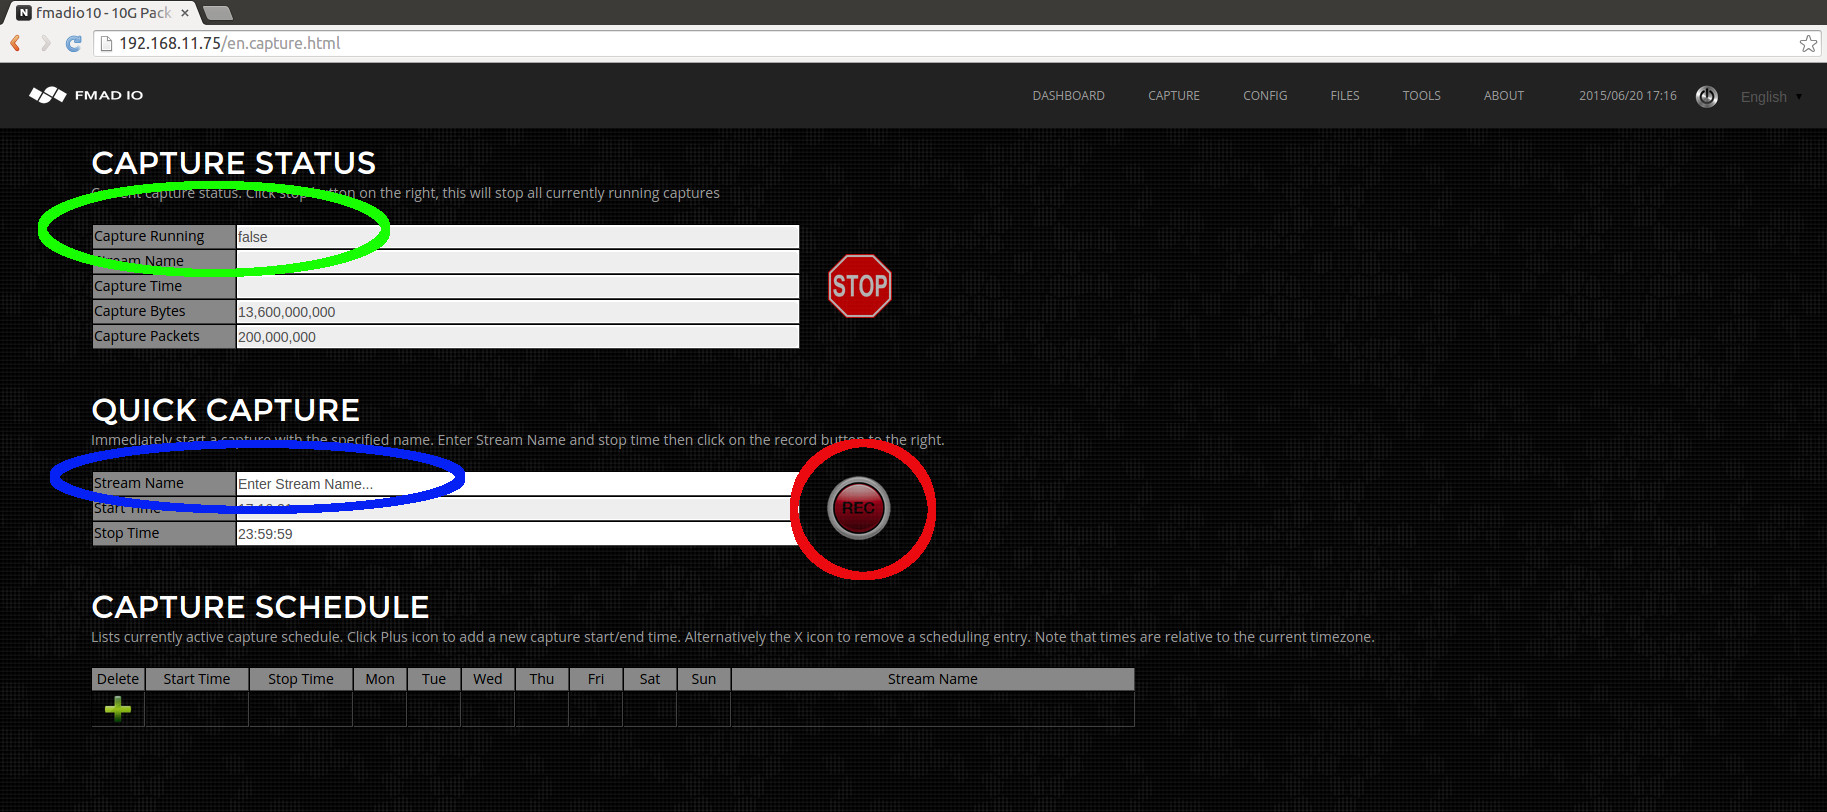
After clicking the REC button the web page will update as shown in the image below.
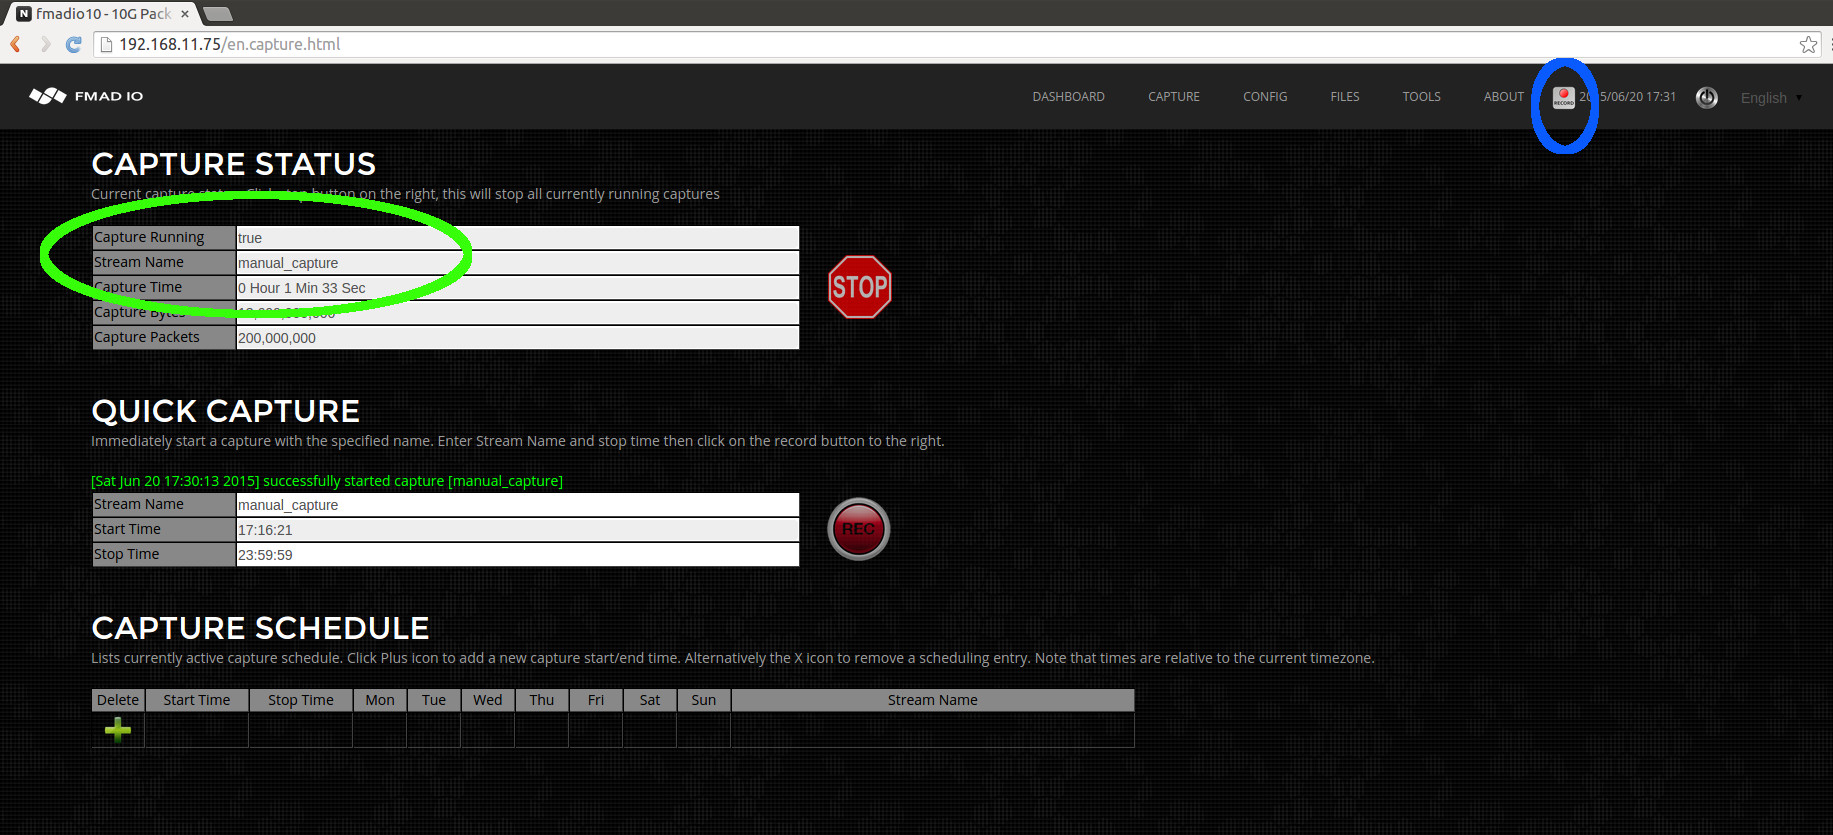
We can see the capture status (highlighted in green above). This shows the capture is running, the capture name, how long it has been running and how many bytes/packets have been captured. Also (highlighted in blue above) on all web pages it shows a small REC icon to show the system is currently in a active capture state.
Web Interface: Stop capture
To stop any capture (both manual and scheduled) simply click on the STOP button as highlighted in green below.
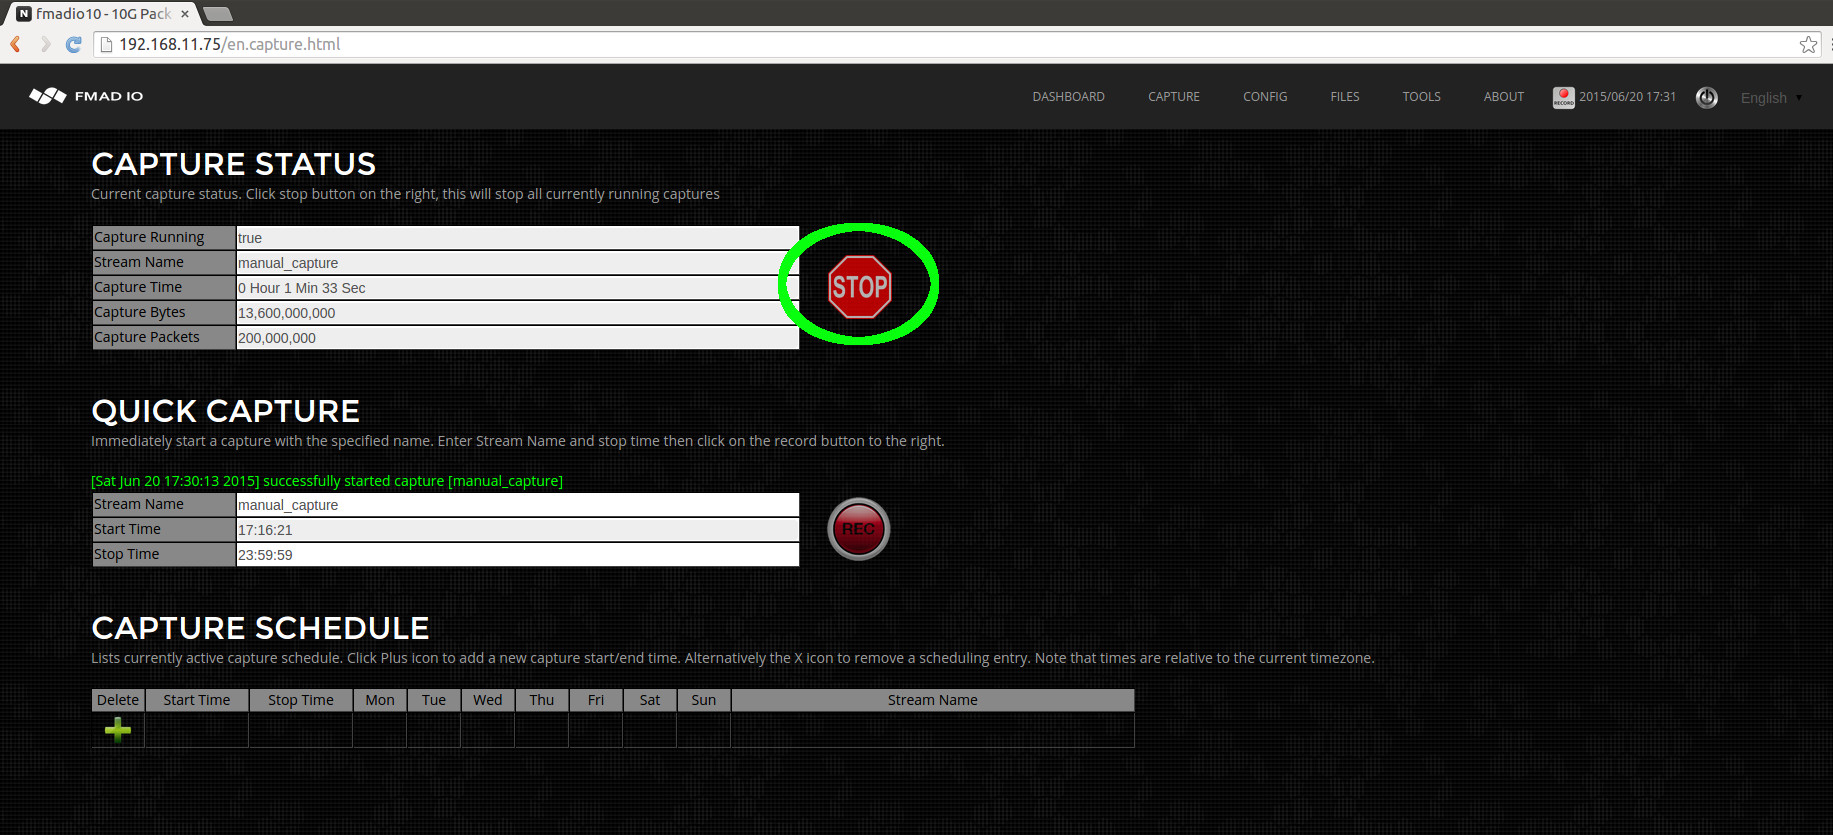
After stopping the web UI will look like the image below.
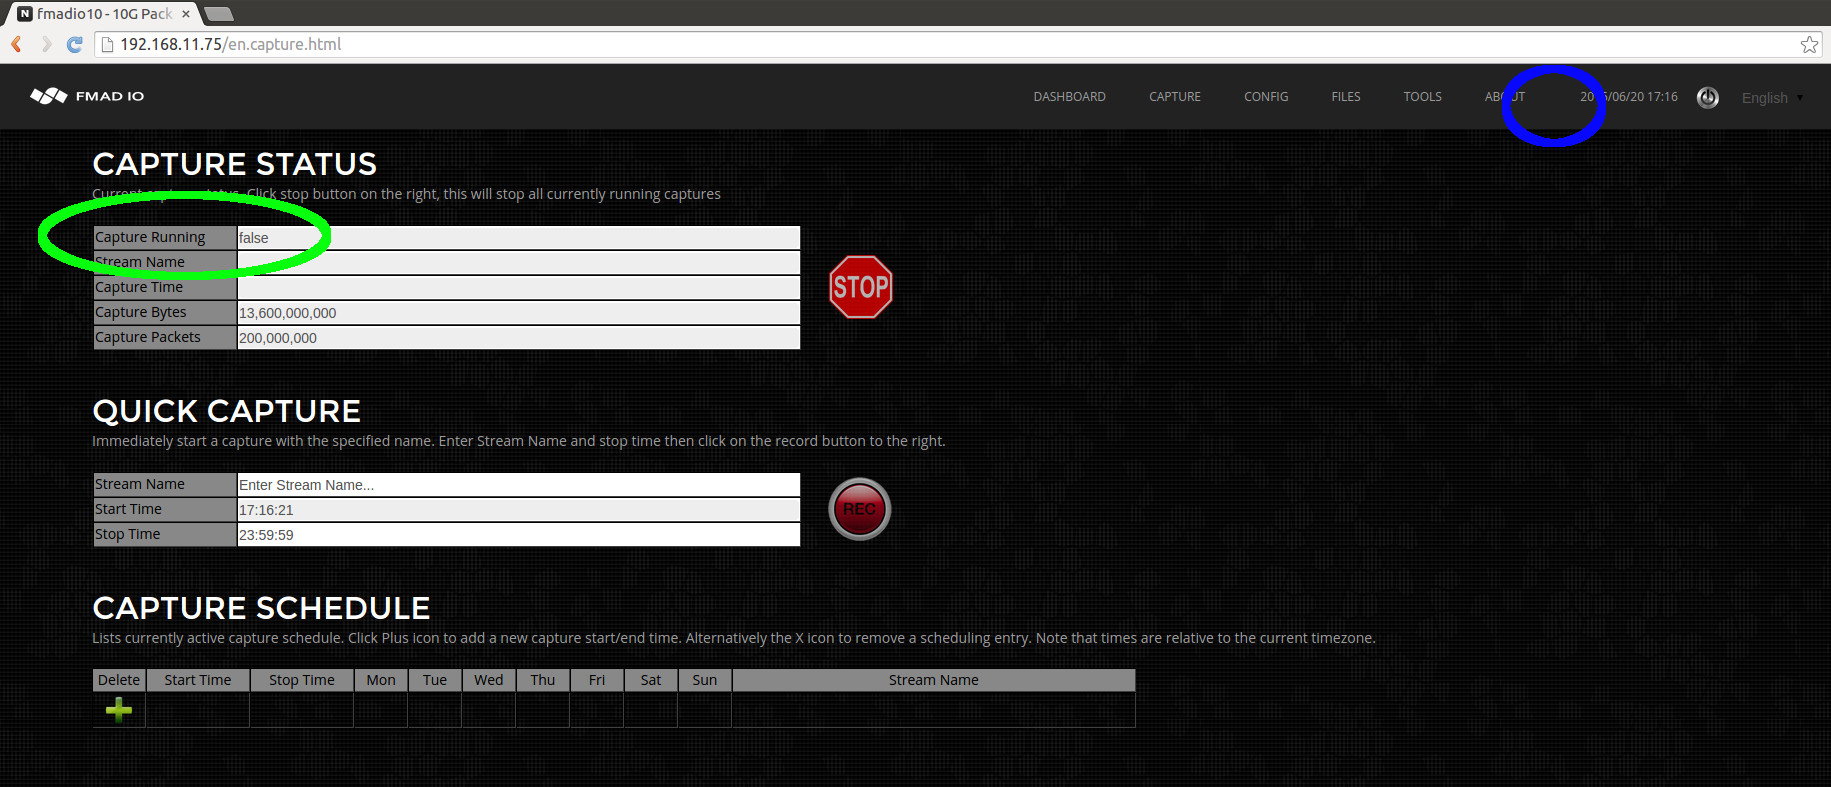
Where the status shows no capture running, "Capture Running: false" (highlighted in green above). In addition, as no capture is active the recording toolbar icon visible on all web pages is now gone (blank space highlighted in blue above).
It is a clean and simple interface. If anything is unclear please contact us support @ fmad .io and we are happy to assist.
Capture Scheduling (Web)
Captures can be automatically scheduled to start/stop based on time and day of the week. This is best when monitoring specific time periods, e.g. Market hours or Broadcast time slots to conserves disk space. Scheduling capture is easy and straightforward as follows.
In this example we are capturing the time slot Monday - Firday from 7AM to 5PM as follows.
Step 1) Add a new row to the scheduling time table. Click on the Green Plus button as hilighted below
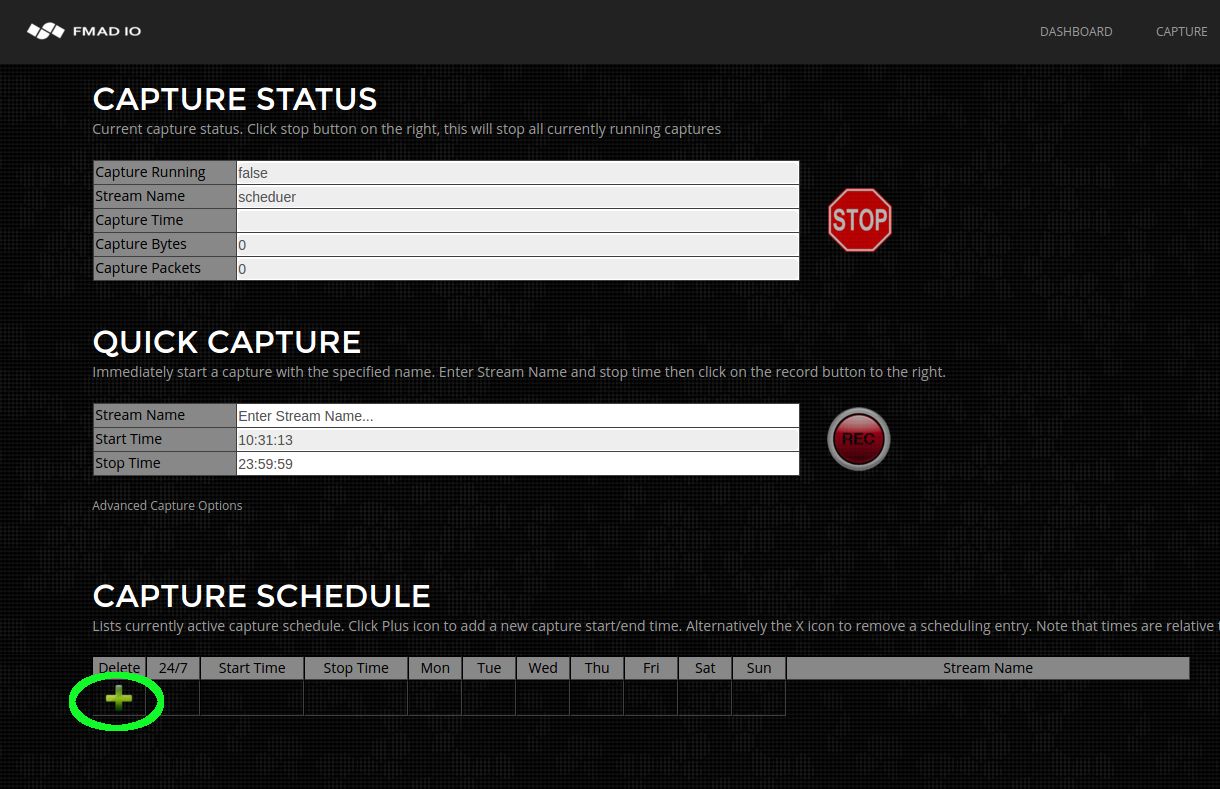
Step 2) A new row with a blank timeslot will be shown as hilighited in green below
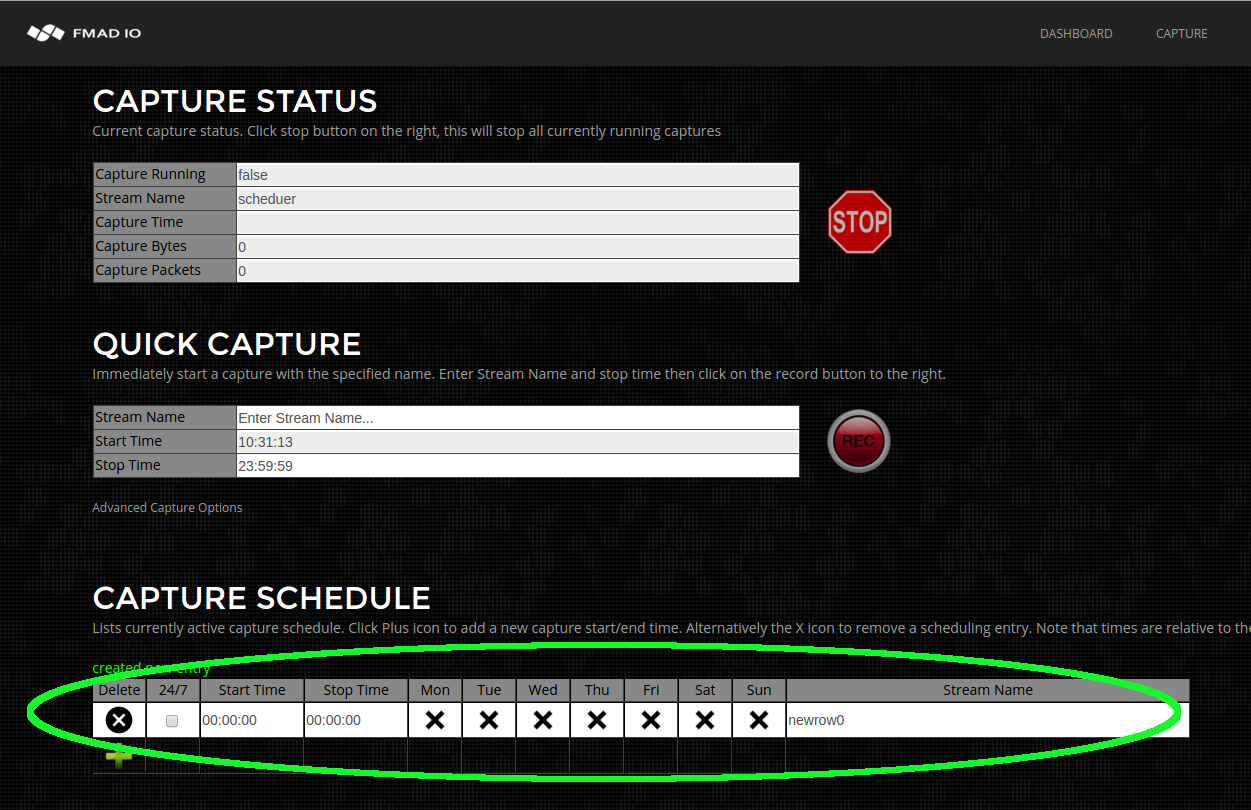
Step 3) Enter a capture name prefix. The system automatically appends the suffix date/time _YYYYMMDD_HHMMSS for every capture started. For example the example below "test_capture" will generate capture names "test_capture_20160101_070000", "test_capture_20160102_070000", etc.
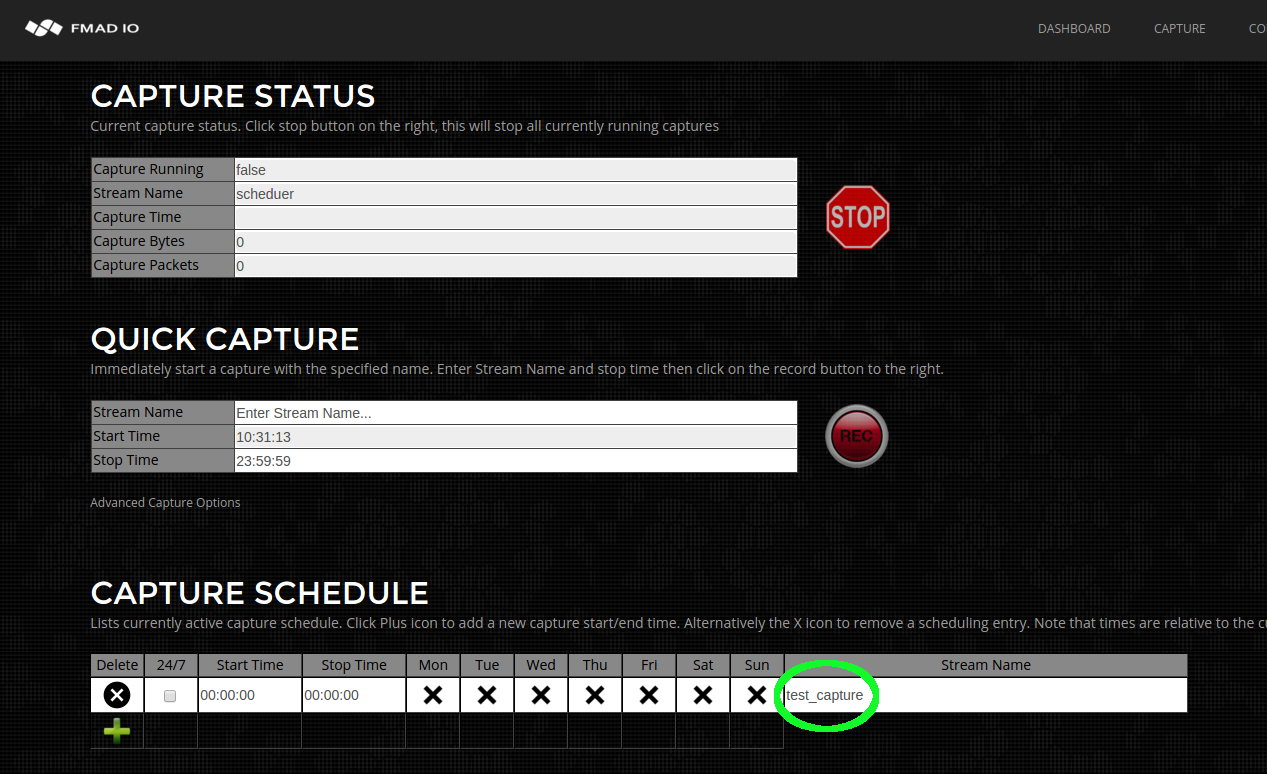
Step 4) Set the start and end times. Time is in HH:MM:SS 24 Hour format, based on the local time. In this example we`ve set from 07:00 -> 17:00 e.g. 7am to 5pm.
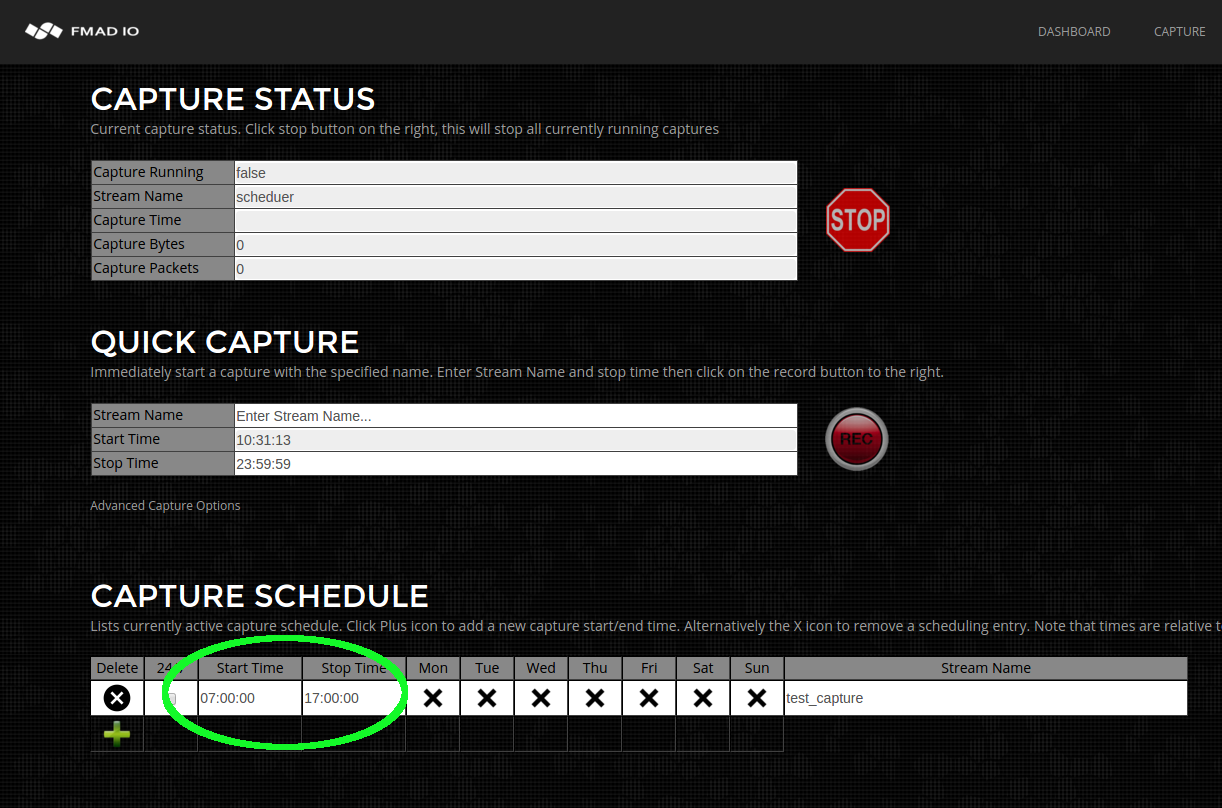
Step 5) Select the days of the week to capture. In this case we`ve selected Monday to Friday.
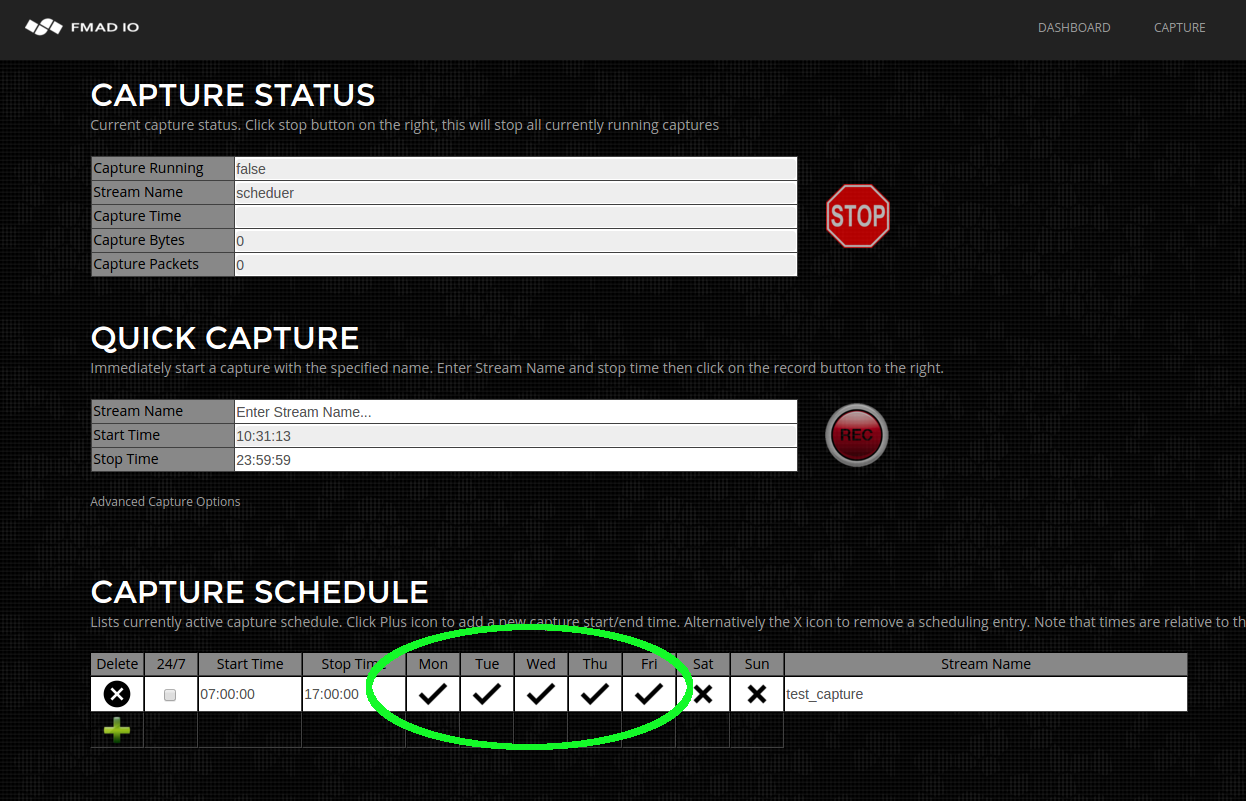
Scheduling captures is simple, multiple schedules are possible e.g One capture name for Mon-Fri and another capture name for Sat-Sun. To remove a scheduled capture click the X button to delete the row.
Capture 24/7 Always On
For many applications capturing 24/7 always on is a requirement. The following steps demonstrate how to setup 24/7 packet capture. In this mode if the Device is powered on it will be capturing, even after rebooting.
Step 1) Add a new row to the scheduling time table. Click on the Green Plus button as hilighted below

Step 2) A new row with a blank timeslot will be shown as hilighited in green below

Step 3) Enter a capture name prefix. The system automatically appends the suffix date/time _YYYYMMDD_HHMMSS for every capture started. For example the example below "always_capture" will generate capture names "always_capture_20160101_000000", "always_capture_20160102_000000", etc.
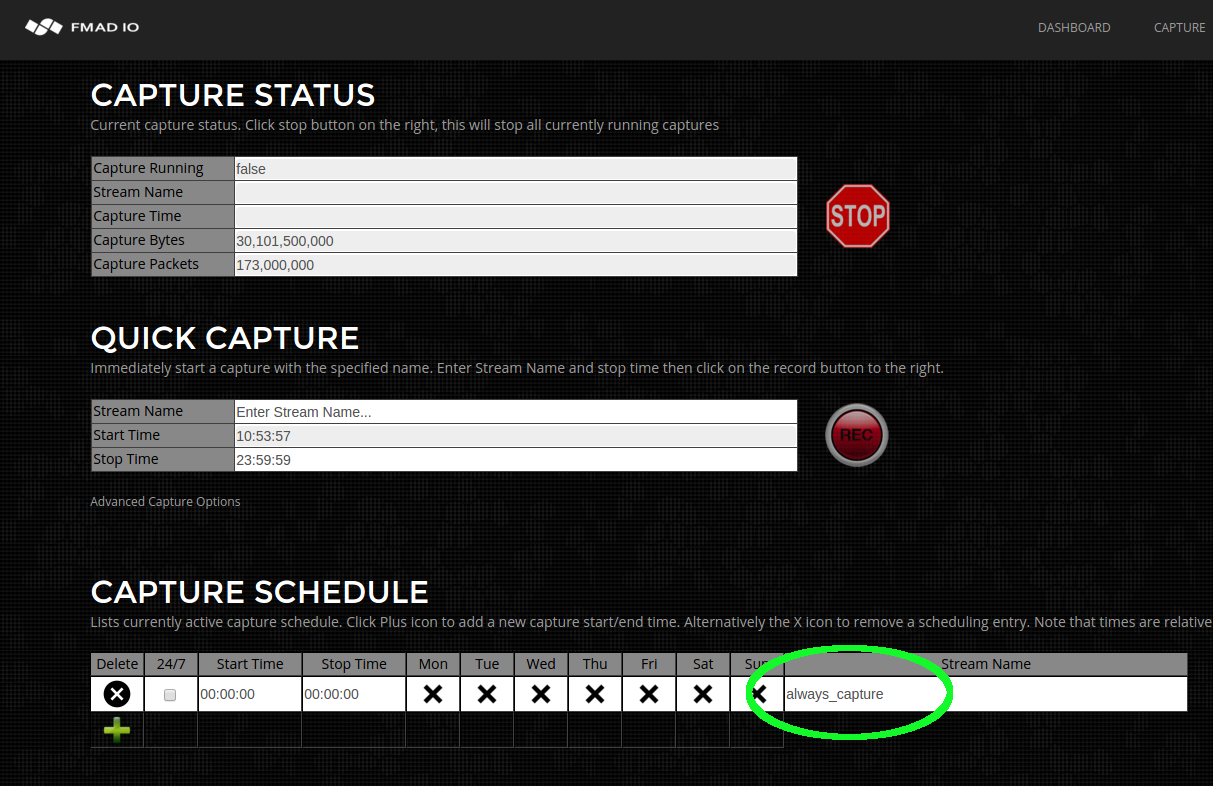
Step 4) Set checkbox for 24/7 capture. Notice how time and day are now greyed out.
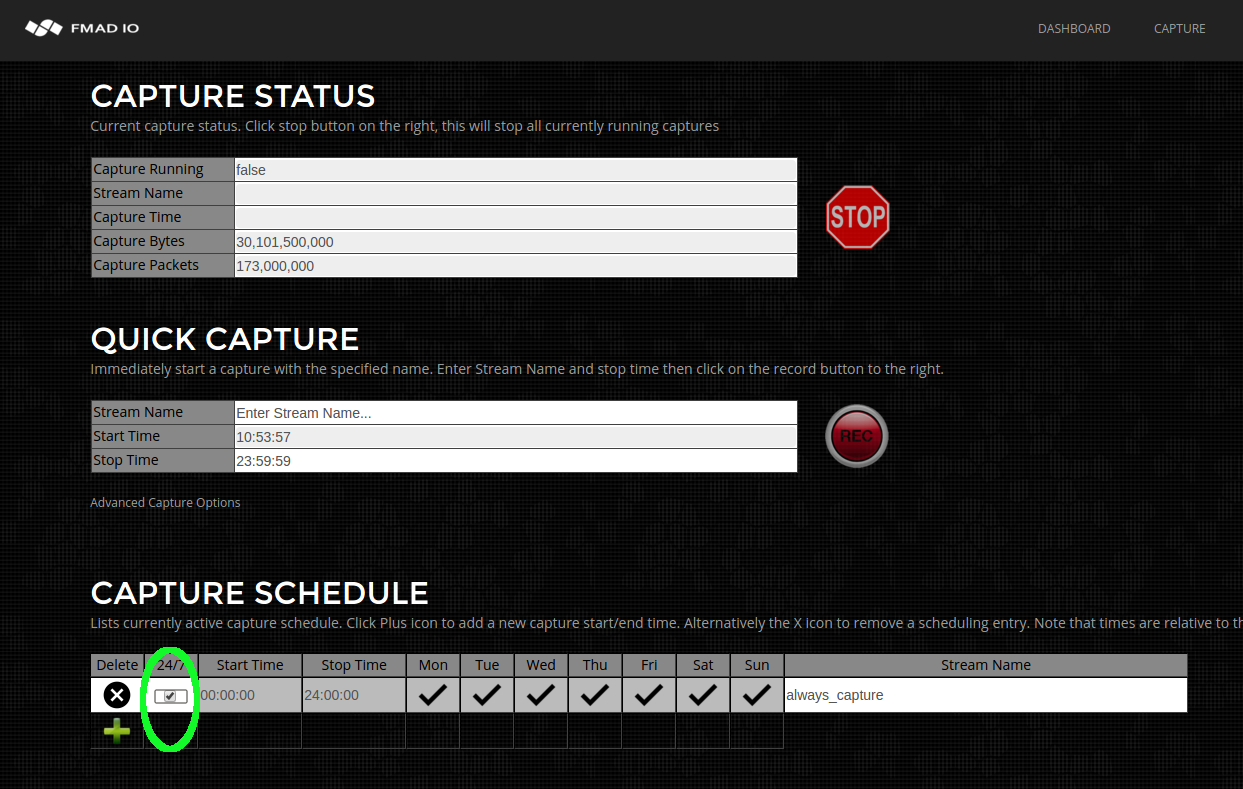
The system will is now in always capture mode, if it is powered on it will be capturing even after rebooting. To stop 24/7 capture delete the row by clicking on the "X" button.
Capture Pre Filter
Filtering the packet stream before writing to storage has many applications. For example, dropping backup transfers, duplicate packet streams or slicing encrypted traffic for compliance reasons. Our FMADIO20 device offers 8 pre-capture filter rules to DROP, SLICE or ACCEPT packets before writing to storage. Please note, you can not mix DROP/SLICE rules with ACCEPT rules. e.g to use ACCPET all rules must be ACCEPT rules.
The following example drops all HTTPS data from writing to storage.
NOTE: Pre Capture Filter is only AVAILABLE on FMADIO20 devices
Step 1) Open the Advanced menu on the capture configuration page.
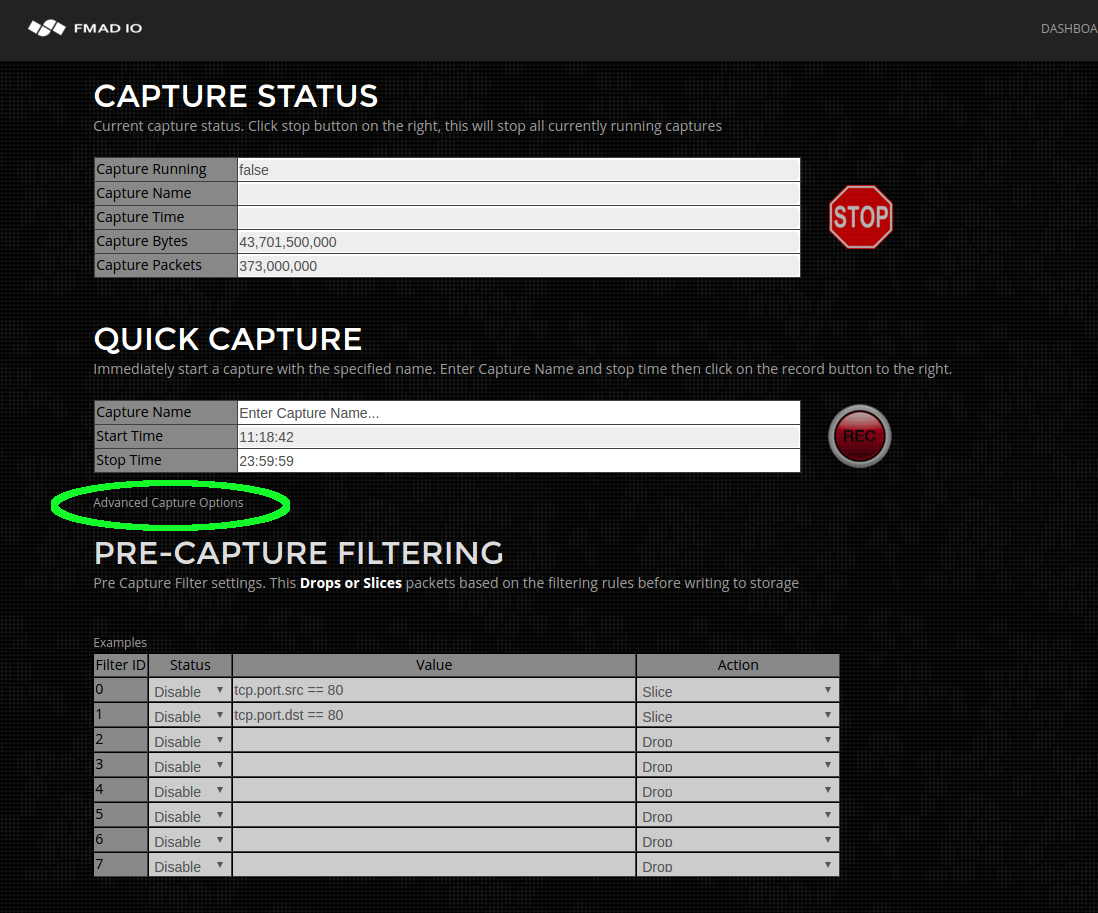
Step 2) Enable one of the Pre Filter rules.
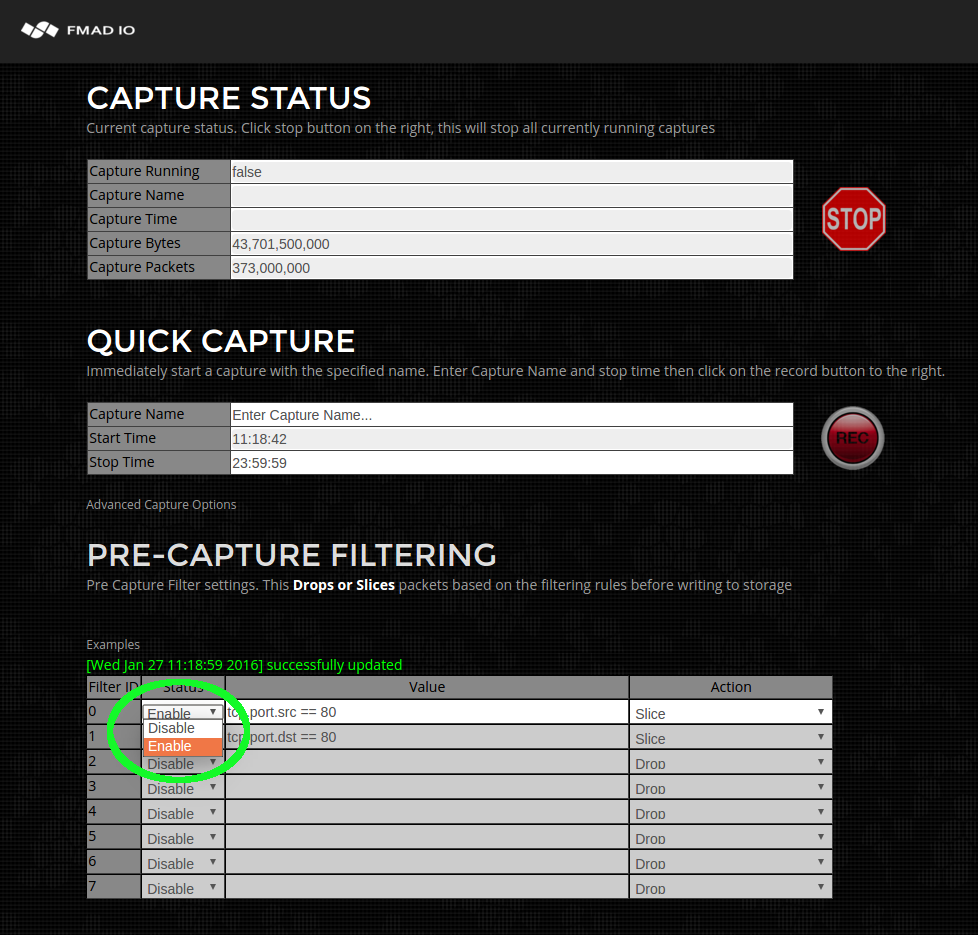
Step 3) Enter the Pre-Filtering condition. In this case it is all HTTPS source traffic
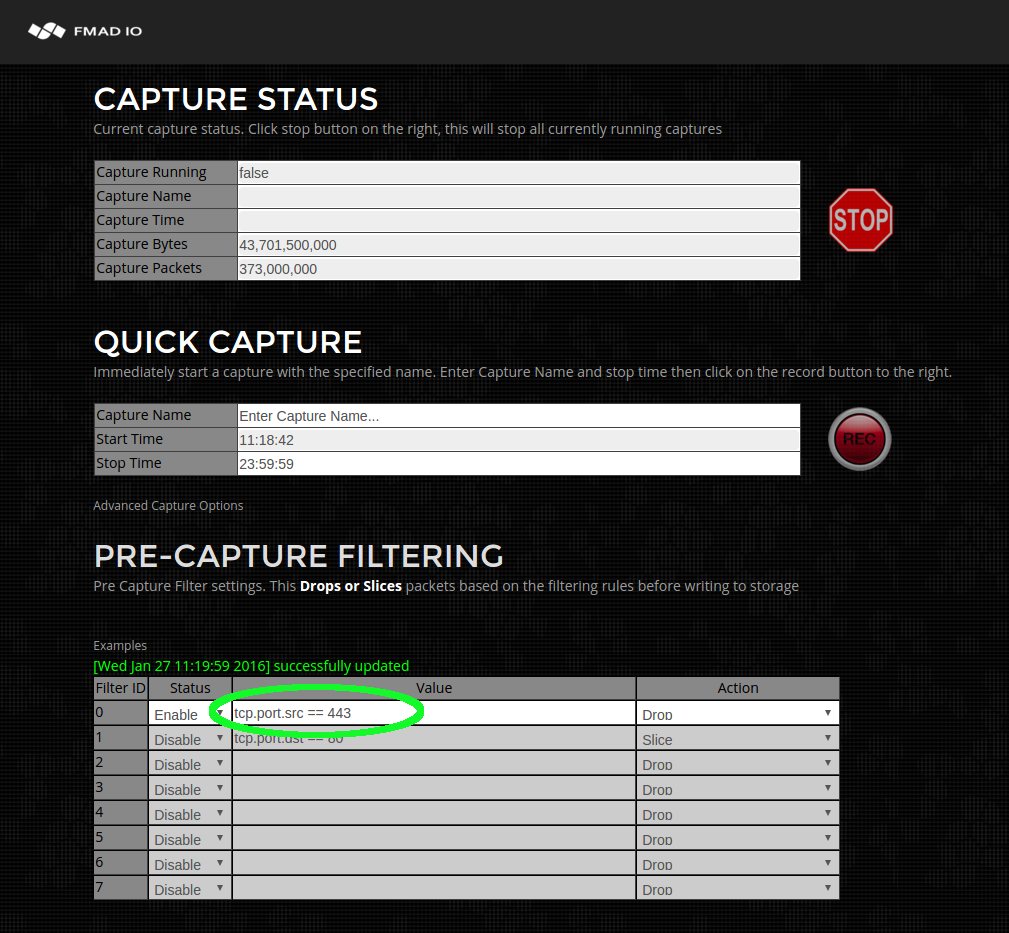
Step 4) Enter the action to take. In this case dropping the packet entirely.
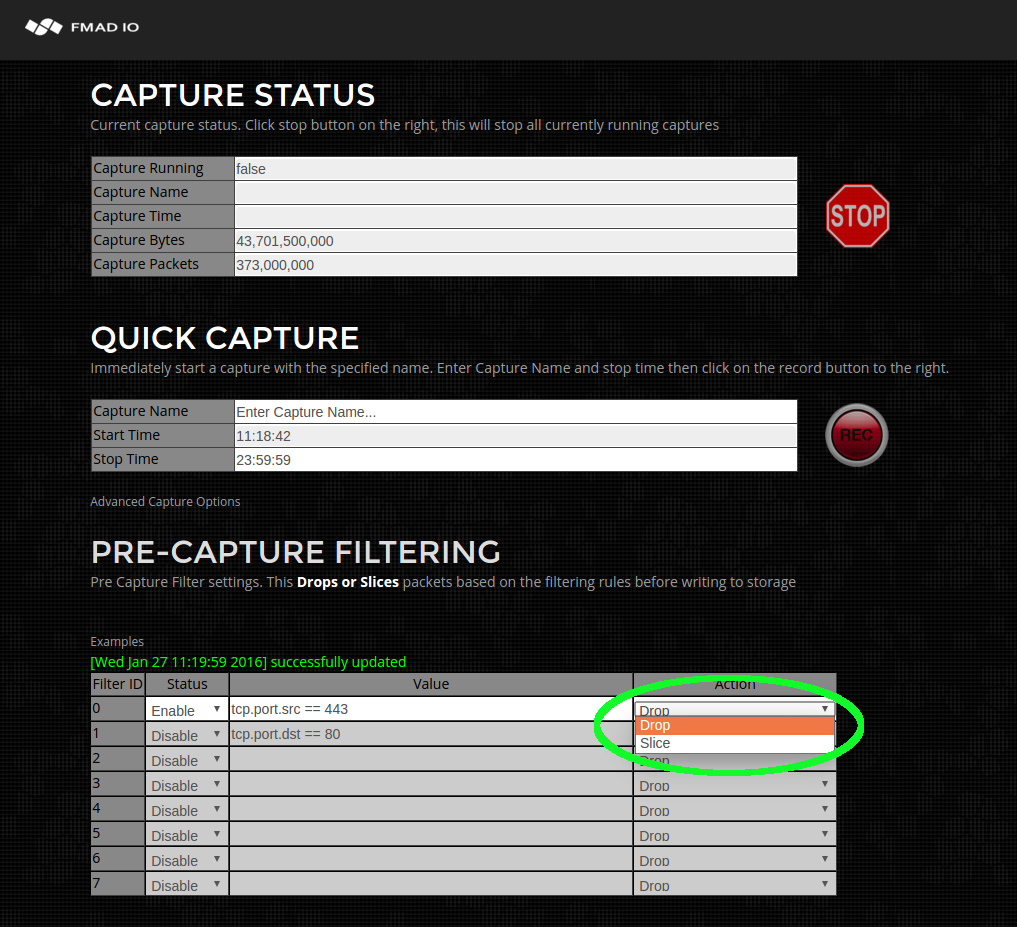
Step 5) Repeat steps for Destination Port for a Bi-Directional HTTPS filtering.
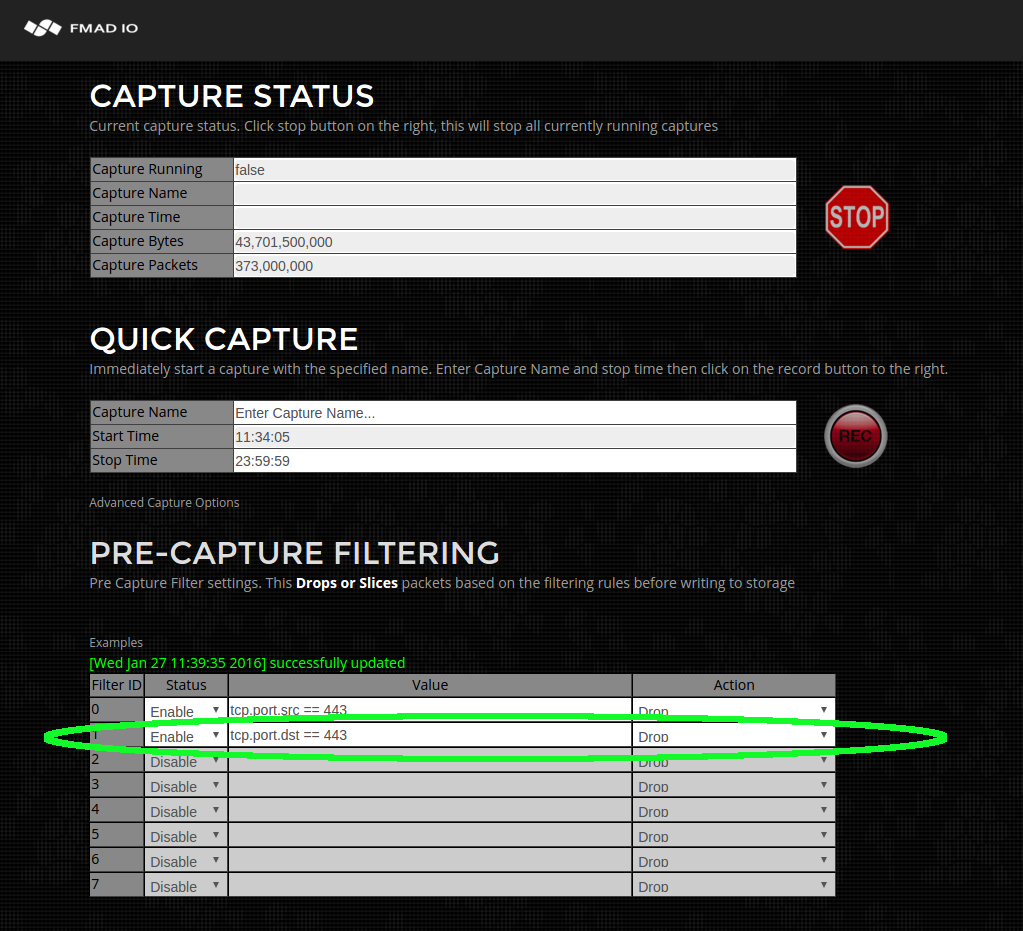
Only 8 simple rules are avaliable as filtering is must operate at full and sustained 20Gbps and 30Mpps. Internally there are 8 seprate mask and value compare`s on the first 128B of a packet. If you require custom filters please contact us.
Example Filters:
| ipv4.src == 192.168.1.1 | IPv4 source filter single IP |
| ipv4.dst == 192.168.1.0/24 | IPv4 dest filter /24 subnet |
| ipv4.proto == tcp | IPv4 filter TCP traffic |
| ipv4.proto == udp | IPv4 filter UDP traffic |
| ipv4.proto == 42 | IPv4 filter protocol 42 |
| ipv6.src == 3ffe:507:0:1:200:86ff:fe05:80da | IPv6 source filter single IP |
| ipv6.dst == 3ffe:507:0:1:200:86ff:fe05:80da | IPv6 source filter single IP |
| mac.src == 00:01:02:03:04:05 | MAC Filter source address |
| mac.dst == 00:01:02:03:04:05 | MAC Filter dest address |
| mac.proto == 0x0806 | MAC Filter hex protcol number 0x0806 (ARP) |
| tcp.port.src == 80 | TCP source port filter 80 (HTTP) |
| tcp.port.dst == 80 | TCP dest port filter 80 (HTTP) |
| udp.port.src == 53 | UDP source port filter 53 (DNS) |
| udp.port.dst == 53 | UDP dest port filter 53 (DNS) |
Capture Start&Stop (CLI)
Starting and stopping captures manually using the Command Line Interface (CLI) is extremely simple. It requires a correctly formatted URL request. In the examples below we use CURL but any program with HTTP functionality will work. Note that in the examples below the username is "user" and the password is "password", please replace with the correct information.
CLI Interface: Capture Status
Before starting and stopping captures, its helpful to check the current systems capture status. The following URL returns the current system status.
curl "http://fmadio.probe.ip/sysmaster/status"
For example when the packet sniffer is active and capturing data, the output will look like the below text
$ curl -u user:pass "http://192.168.11.75/sysmaster/status"
uptime,                                             0D 3H 36M
packets_received,                                   453468480
packets_dropped,                                            0
packets_errors,                                             0
packets_captured,                                   453468480
bytes_captured,                                   30835857408
bytes_pending,                                     4812701696
bytes_cache,                                                0
bytes_disk,                                       33742389248
capture_link,                                              up
capture_link_uptime,                                0D 3H 36M
capture_link_speed,                                     10000
capture_bytes,                                    31705286552
capture_packets,                                    466254210
capture_bps,                                       7726900224
capture_pps,                                         14203859
capture_name,                              manual_capture_cli
capture_active,                                          true
And when the system is not capturing, it looks like the following below
$ curl -u user:pass "http://192.168.11.75/sysmaster/status"
uptime,                                             0D 3H 28M
packets_received,                                   400000000
packets_dropped,                                            0
packets_errors,                                             0
packets_captured,                                   400000000
bytes_captured,                                   27200000000
bytes_pending,                                              0
bytes_cache,                                                0
bytes_disk,                                       33600831488
capture_link,                                              up
capture_link_uptime,                                0D 3H 28M
capture_link_speed,                                     10000
capture_bytes,                                    27200000000
capture_packets,                                    400000000
capture_bps,                                                0
capture_pps,                                                0
capture_name,                                            none
capture_active,                                         false
As you can see this is a simple format that's easy to parse, and excellent for compact monitoring scripts to use. For example:
$ curl -s -u user:pass "http://192.168.11.75/sysmaster/status" | grep capture_active
capture_active,                                          true
CLI Interface: Start Capture
Starting captures from the CLI is also extremely easy, using the following URL format
http://capture.sys.ip/sysmaster/capture_start?StreamName=enter_stream_name_here
This will start a capture and return in JSON format the result of the request. The following example starts a capture with the name "cli_capture", then confirms its capture status
$ curl -u user:pass "http://192.168.11.75/sysmaster/capture_start?StreamName=cli_capture"
{"Status":true,"Str":"[Sat Jun 20 20:28:55 2015] successfully started capture [cli_capture]"}


$ curl -u user:pass "http://192.168.11.75/sysmaster/status"
uptime,                                              0D 0H 3M
packets_received,                                           0
packets_dropped,                                            0
packets_errors,                                             0
packets_captured,                                           0
bytes_captured,                                             0
bytes_pending,                                              0
bytes_cache,                                                0
bytes_disk,                                       22325755904
capture_link,                                              up
capture_link_uptime,                                 0D 0H 3M
capture_link_speed,                                     10000
capture_bytes,                                              0
capture_packets,                                            0
capture_bps,                                                0
capture_pps,                                                0
capture_name,                                     cli_capture
capture_active,                                          true
CLI Interface: Stop Capture
Stopping captures via CLI is even simpler as it does not require a stream name. Use the following URL to stop any captures currently running.
http://capture.sys.ip/sysmaster/capture_stop
The following example shows the previous capture state, stopping the capture and verifying capture has stopped.
$ curl -u user:pass "http://192.168.11.75/sysmaster/status"
uptime,                                              0D 0H 9M
packets_received,                                   101000000
packets_dropped,                                            0
packets_errors,                                             0
packets_captured,                                   101000000
bytes_captured,                                    6867999744
bytes_pending,                                     7142375424
bytes_cache,                                                0
bytes_disk,                                       23657971712
capture_link,                                              up
capture_link_uptime,                                 0D 0H 9M
capture_link_speed,                                     10000
capture_bytes,                                     6868000000
capture_packets,                                    101000000
capture_bps,                                                0
capture_pps,                                                0
capture_name,                                     cli_capture
capture_active,                                          true


$ curl -u user:pass "http://192.168.11.75/sysmaster/capture_stop"
{"Status":true,"Str":"[Sat Jun 20 20:39:17 2015] successfully stopped capture [cli_capture]"}


$ curl -u user:pass "http://192.168.11.75/sysmaster/status"
uptime,                                             0D 0H 11M
packets_received,                                   101000000
packets_dropped,                                            0
packets_errors,                                             0
packets_captured,                                   101000000
bytes_captured,                                    6867999744
bytes_pending,                                              0
bytes_cache,                                                0
bytes_disk,                                       30809784320
capture_link,                                              up
capture_link_uptime,                                0D 0H 11M
capture_link_speed,                                     10000
capture_bytes,                                     6868000000
capture_packets,                                    101000000
capture_bps,                                                0
capture_pps,                                                0
capture_name,                                            none
capture_active,                                         false
Very simple and very easy so you spend time on the important tasks.
CLI Interface: Summary
Quick summary of CLI operations follows:
| Operation | URL |
| Start Capture |
http://capture.sys.ip/sysmaster/capture_start?StreamName=insert_stream_name_here
|
| Stop Capture |
http://capture.sys.ip/sysmaster/capture_stop
|
| Capture Status |
http://capture.sys.ip/sysmaster/status
|
PCAP Download (Web)
Simple and intuitive downloading of PCAP`s is an important design goal of the FMADIO capture system. The FMADIO capture system provides simultaneous multiple views of the data for example 1 second PCAP split, 1 hour PCAP splits, 1GB splits and many more. Of course fetching the entire PCAP as a single file is also supported.
The list of supported PCAP split options is as follows.
- Single file
- Split 1 Second
- Split 10 Second
- Split 1 Minute
- Split 10 Minute
- Split 15 Minute
- Split 1 Hour
- Split 1 MB size
- Split 10 MB size
- Split 100 MB size
- Split 1 GB size
- Split 10 GB size
- Split 100 GB size
- Split 1 TB size
All views/splits are available for every capture simultaneously
You can view, download or analyze captures with a 1 hour split but also 1 second split without any configuration changes. Our highly optimized software enables splitting captures in multiple ways enabling efficient network trouble shooting.
Web: Download PCAP
Start by accessing the File menu as highlighted in green below.
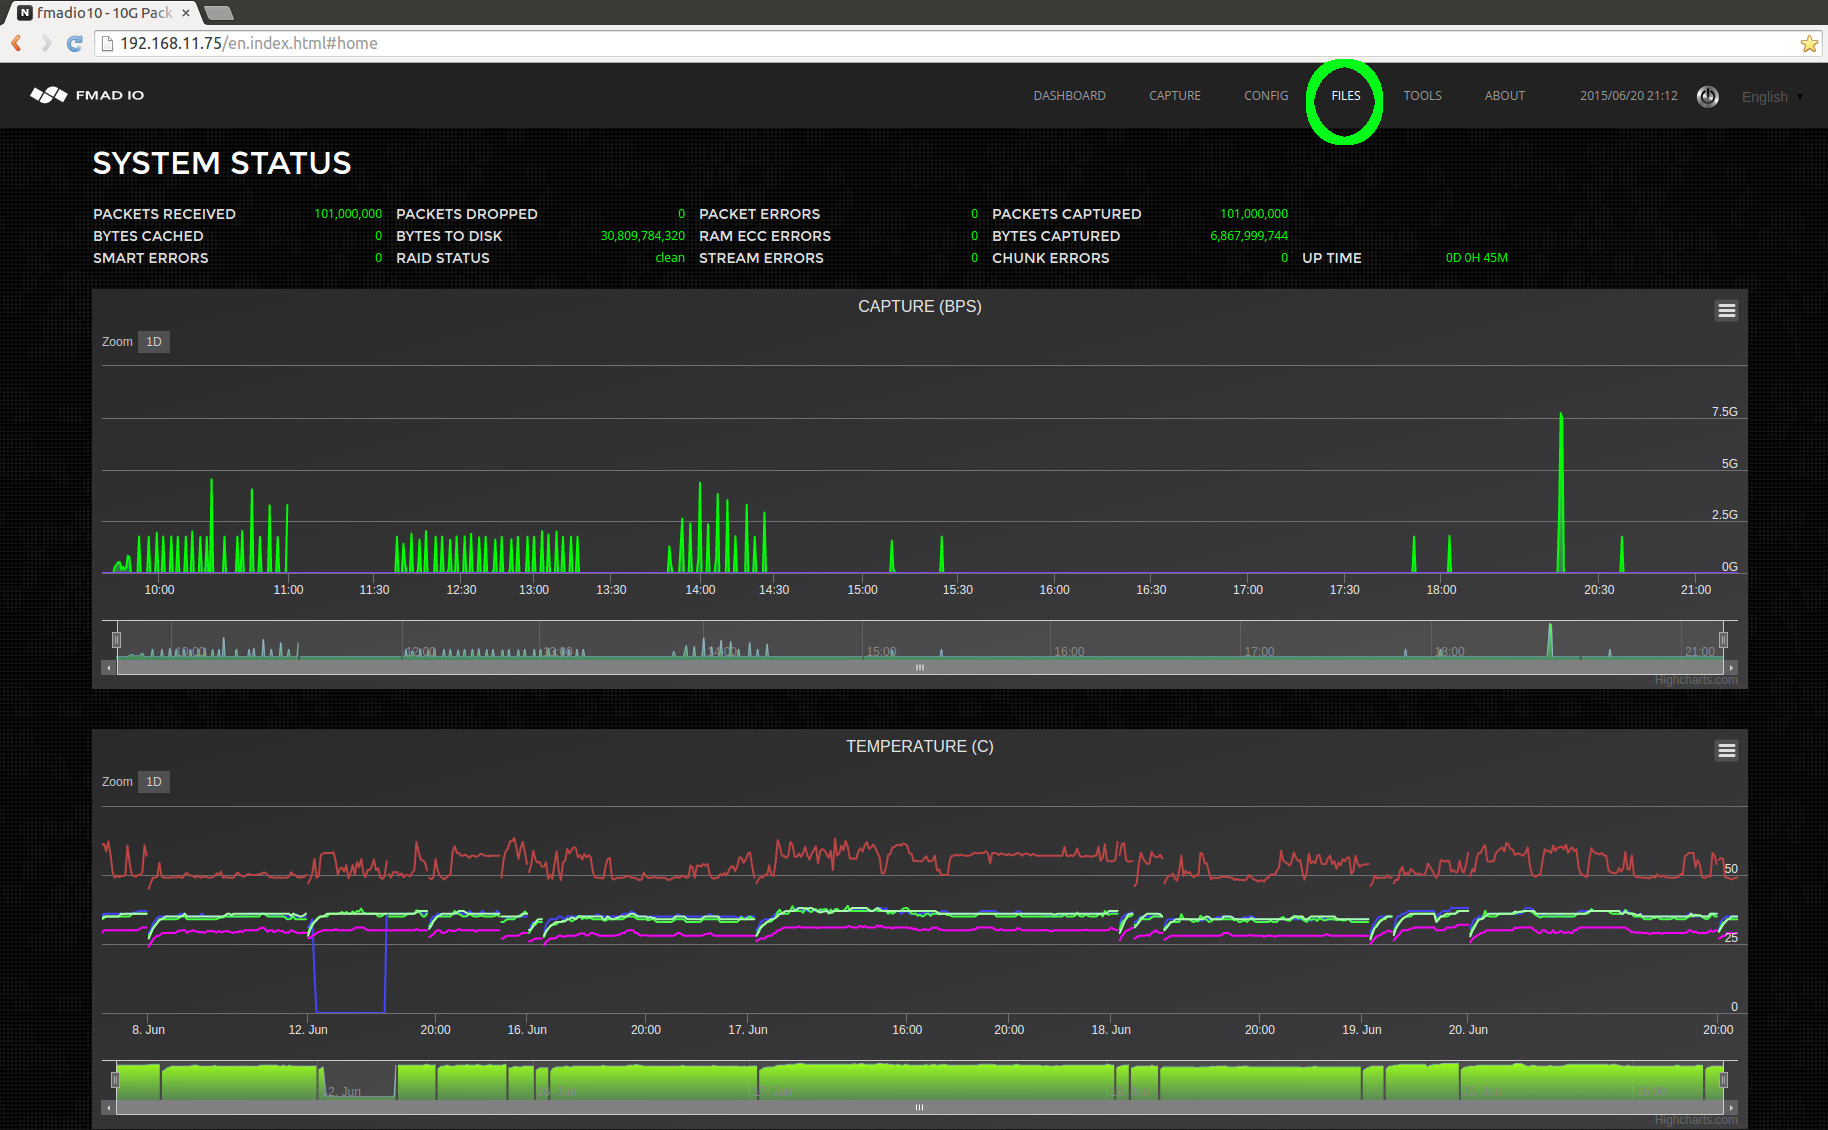
After clicking on the Files menu, it shows all captures captures currently on the system. In the example below we want the capture named "manual_capture_cli_20150620_1836", the icon highlighted in blue is a quick link to download the entire capture as a single PCAP file.
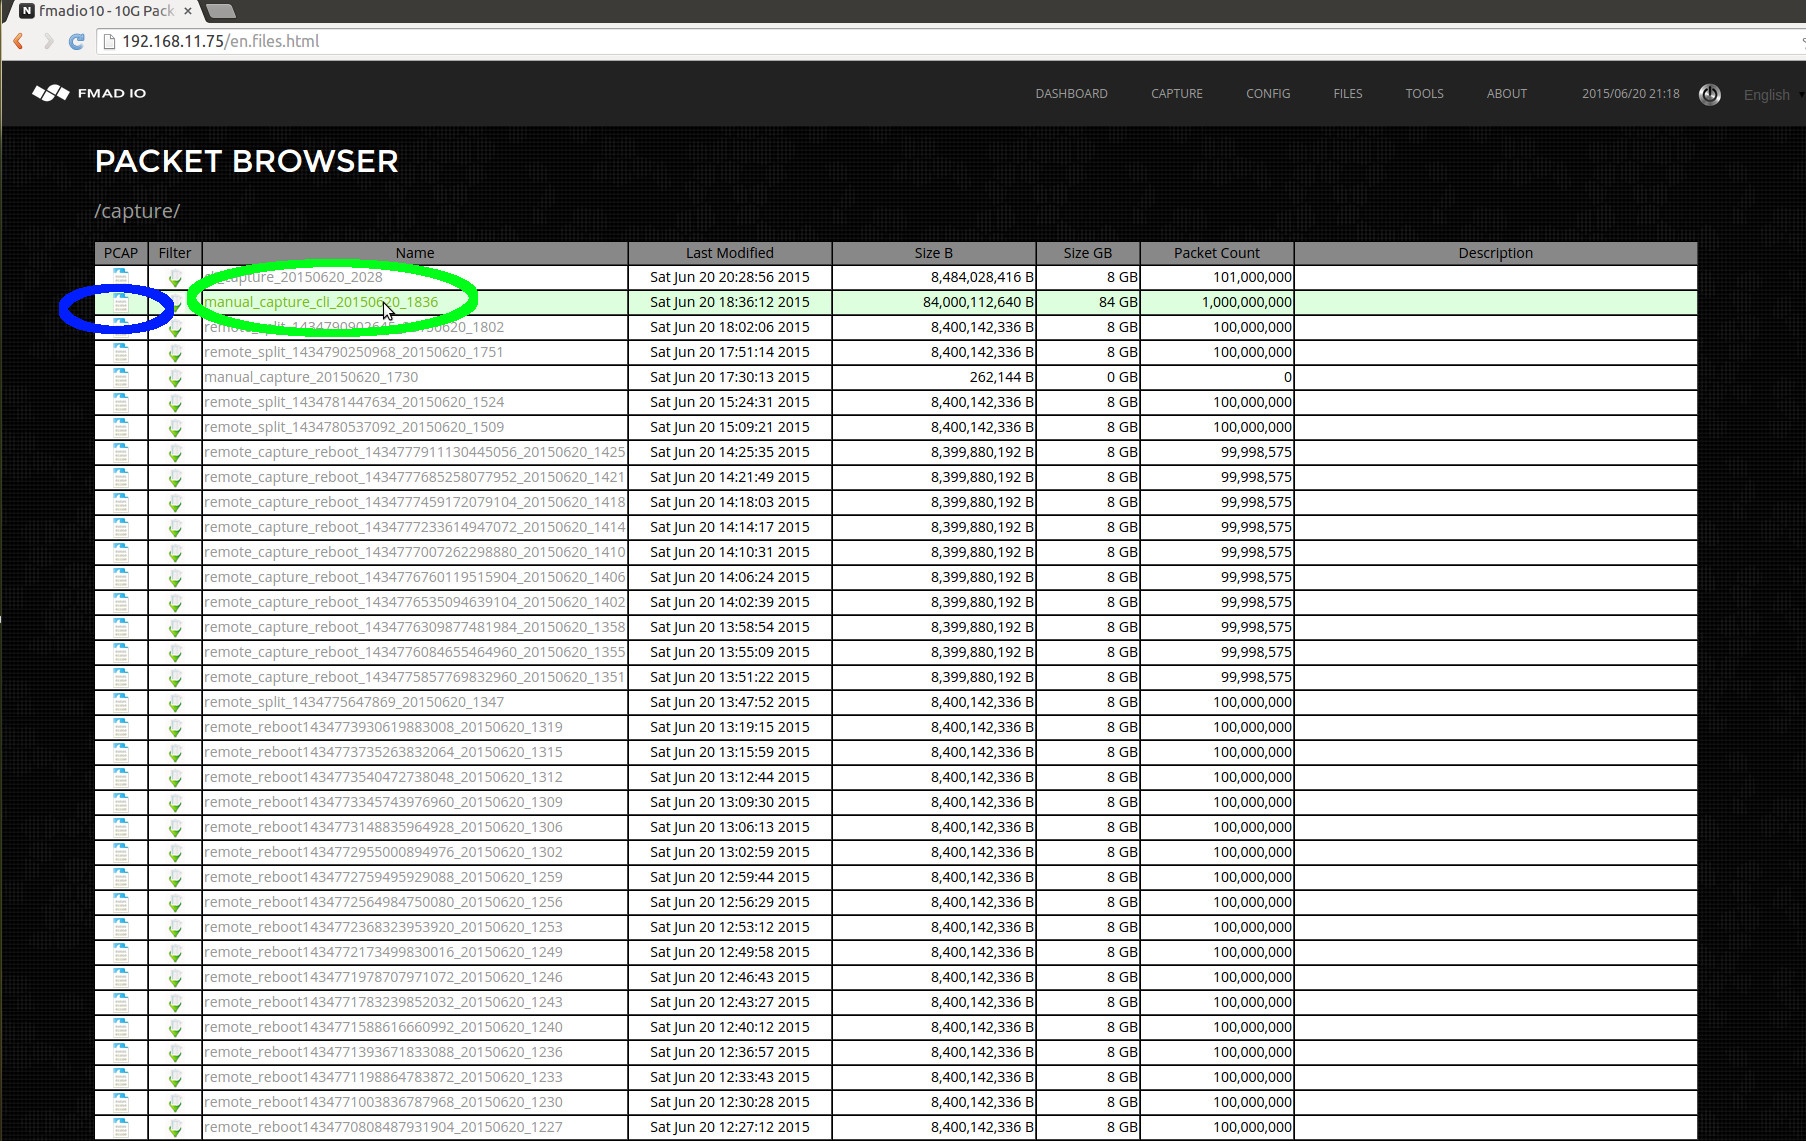
When clicking on the link highlighted in green above, the system displays all splits and views of the capture(shown in the image below). As all views of the capture are displayed, it enables you to select the most appropriate view for the task at hand. In this case we will select 1 second split as highlighted in green below.
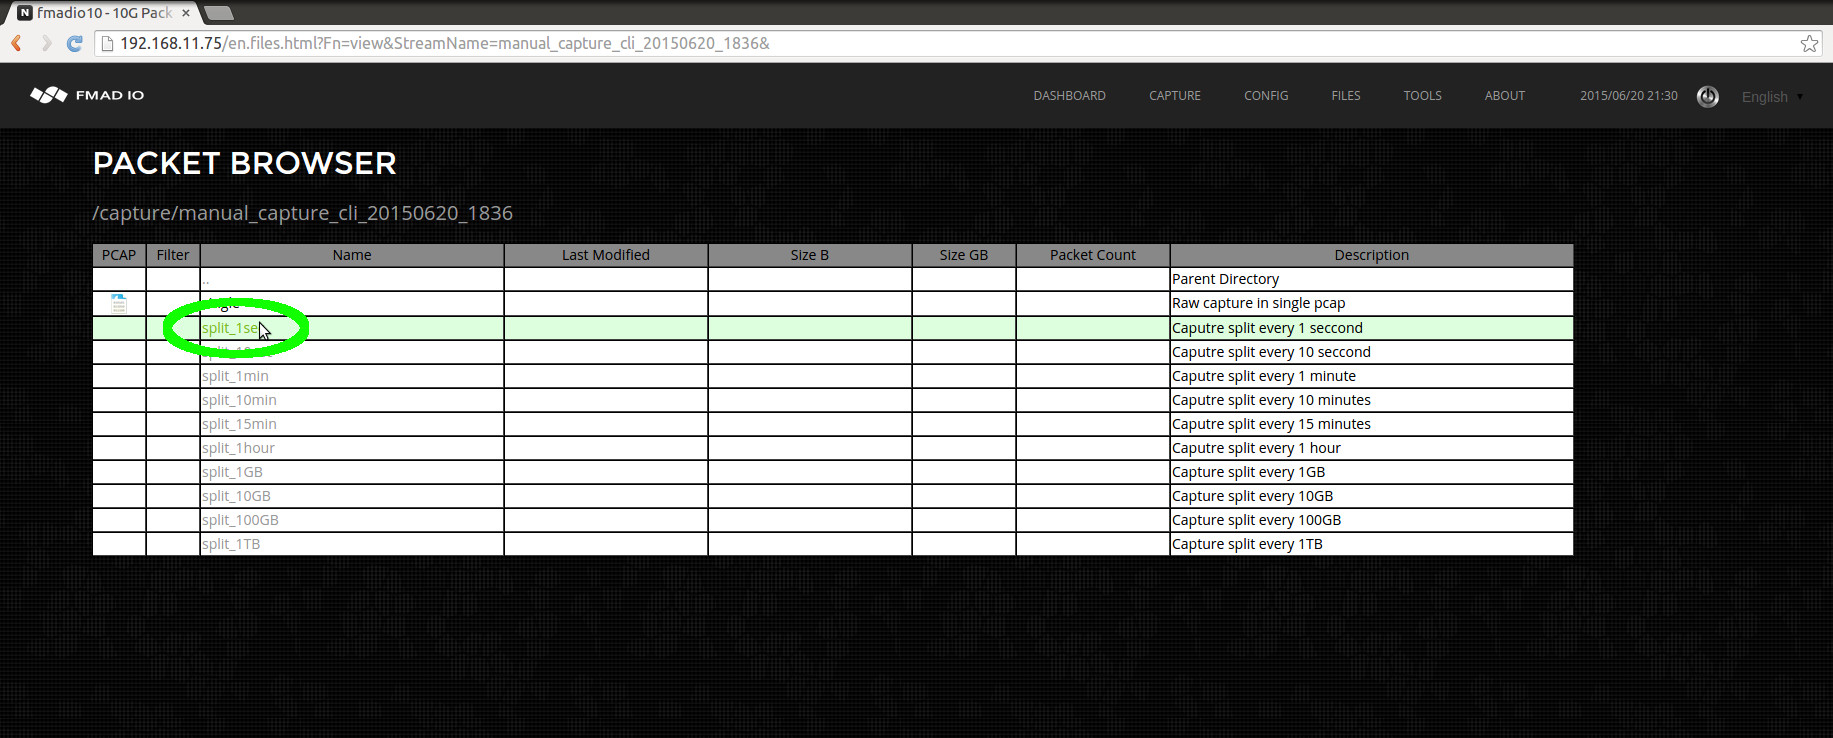
After clicking on the 1 second view from the above image, the full list of per second splits is seen in the screenshot below.
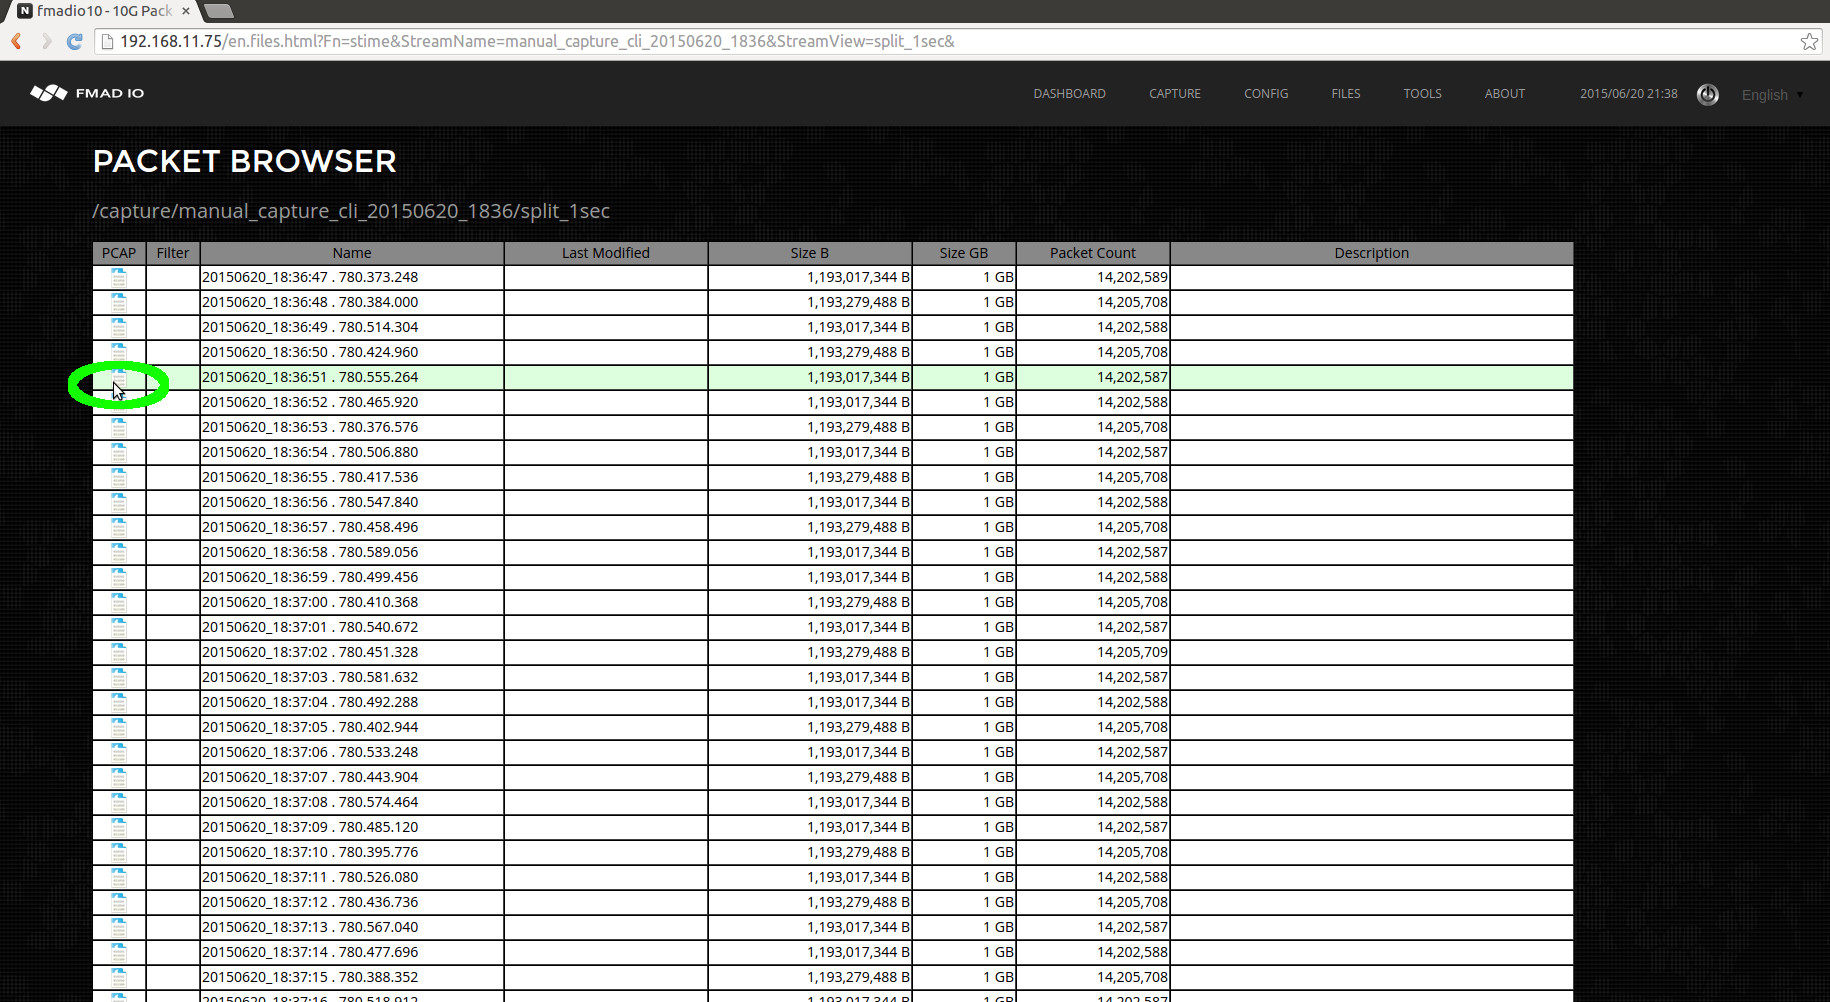
Clicking on the PCAP icon (highlighted in green above) starts a download of the file to local disk. After the download has completed, the file can be opened up in Wireshark or any other PCAP processing utility. In the example below Wireshark has loaded the requested file.
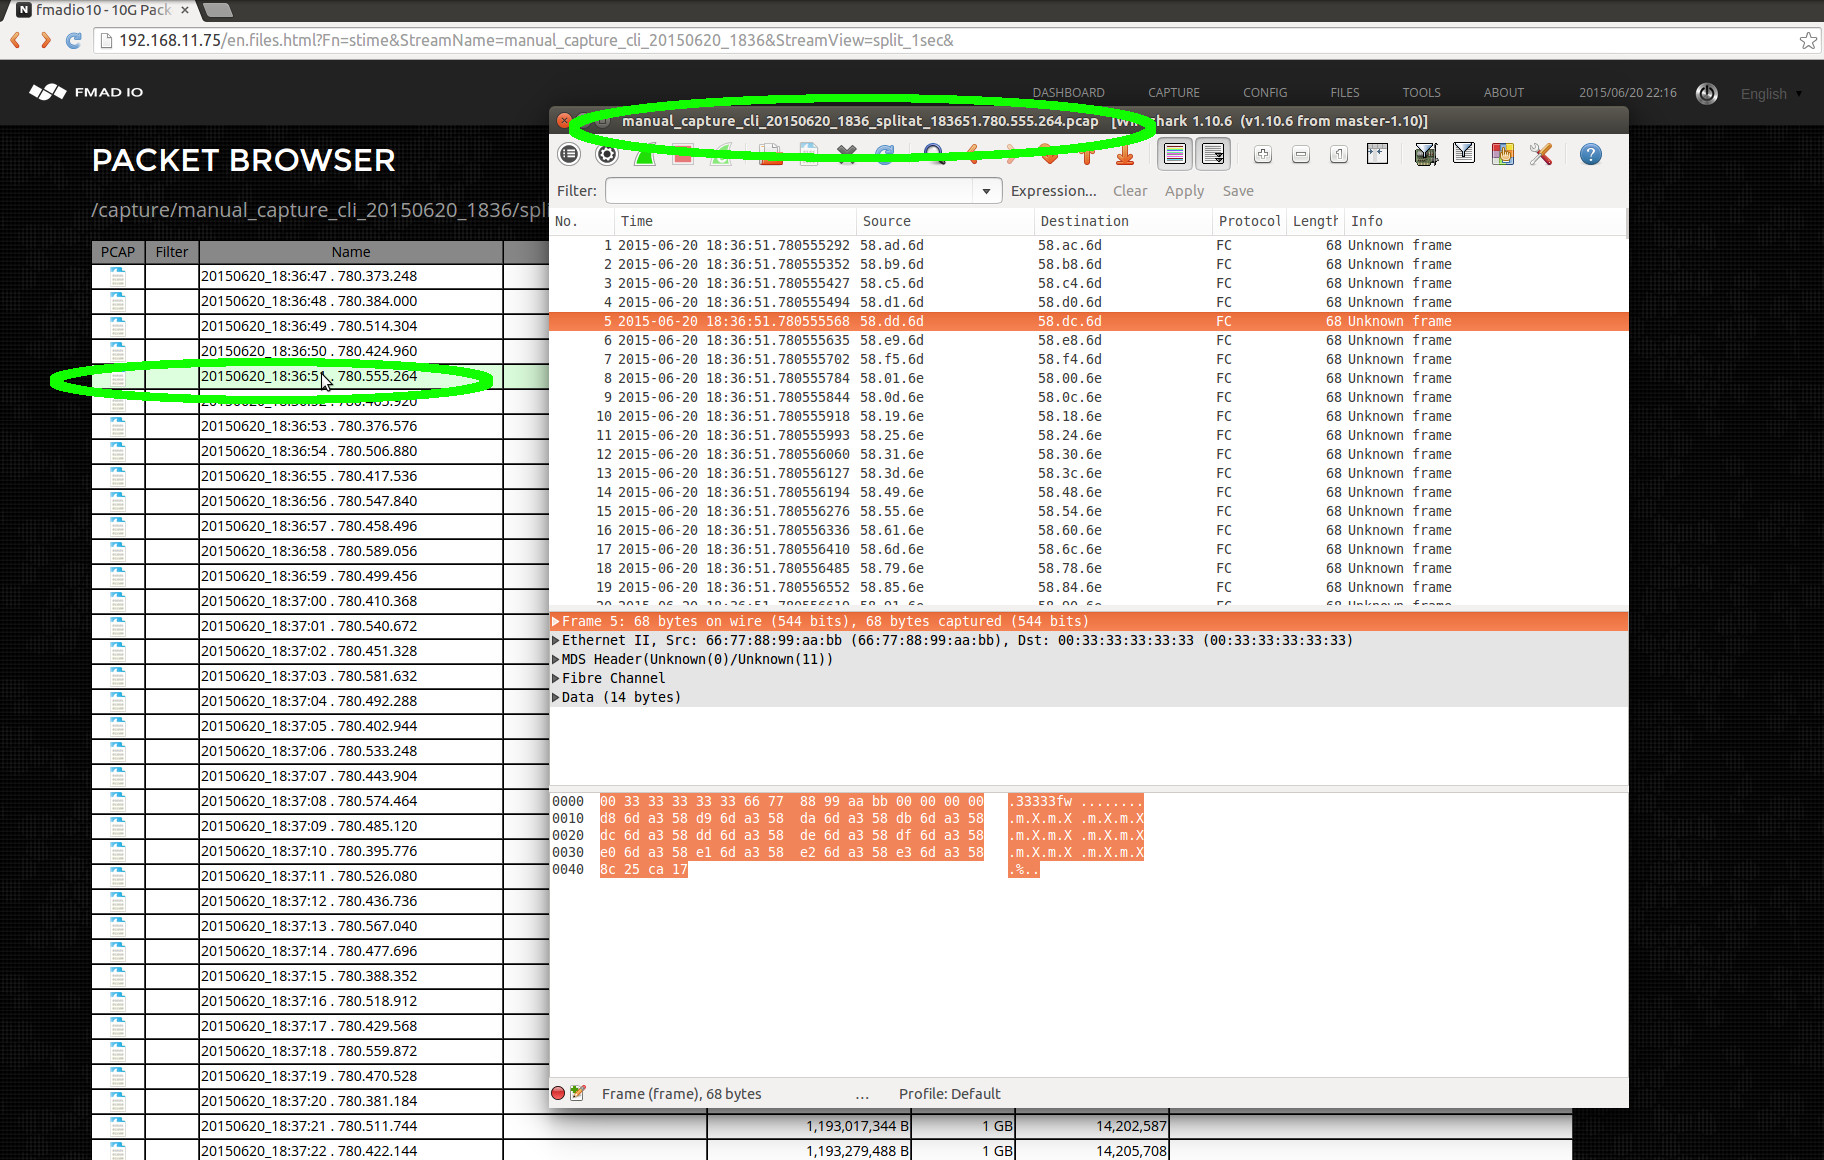
This is a short example of how PCAP files are extracted from the system. See the Advanced section for details on other approaches.
PCAP Download (CLI)
Downloading via a Web interface is intuitive and simple, but is not ideal when integrating with existing scripts and infrastructure. In this section we demonstrate how to use HTTP requests and a simple Command Line Interface (CLI) to find and download the PCAP`s you need.
CLI: Download PCAP
Start by listing all streams on the device in a comma delimited text file using the following URL format
http://192.168.11.75/plain/list
For example.
$ curl -u user:pass "http://192.168.11.75/plain/list"

Filename                                                    , Size Bytes    , Packet Count  , Date                   ,Single PCAP Link,File Link,
cli_capture_20150620_2028                                   ,     8484028416,      101000000, Sat Jun 20 20:28:56 2015,/pcap/single?StreamName=cli_capture_20150620_2028&,/en.files.html?Fn=view&StreamName=cli_capture_20150620_2028&,
manual_capture_cli_20150620_1836                            ,    84000112640,     1000000000, Sat Jun 20 18:36:12 2015,/pcap/single?StreamName=manual_capture_cli_20150620_1836&,/en.files.html?Fn=view&StreamName=manual_capture_cli_20150620_1836&,
remote_split_1434790902645_20150620_1802                    ,     8400142336,      100000000, Sat Jun 20 18:02:06 2015,/pcap/single?StreamName=remote_split_1434790902645_20150620_1802&,/en.files.html?Fn=view&StreamName=remote_split_1434790902645_20150620_1802&,
remote_split_1434790250968_20150620_1751                    ,     8400142336,      100000000, Sat Jun 20 17:51:14 2015,/pcap/single?StreamName=remote_split_1434790250968_20150620_1751&,/en.files.html?Fn=view&StreamName=remote_split_1434790250968_20150620_1751&,
manual_capture_20150620_1730                                ,         262144,              0, Sat Jun 20 17:30:13 2015,/pcap/single?StreamName=manual_capture_20150620_1730&,/en.files.html?Fn=view&StreamName=manual_capture_20150620_1730&,
remote_split_1434781447634_20150620_1524                    ,     8400142336,      100000000, Sat Jun 20 15:24:31 2015,/pcap/single?StreamName=remote_split_1434781447634_20150620_1524&,/en.files.html?Fn=view&StreamName=remote_split_1434781447634_20150620_1524&,
remote_split_1434780537092_20150620_1509                    ,     8400142336,      100000000, Sat Jun 20 15:09:21 2015,/pcap/single?StreamName=remote_split_1434780537092_20150620_1509&,/en.files.html?Fn=view&StreamName=remote_split_1434780537092_20150620_1509&,
remote_capture_reboot_1434777911130445056_20150620_1425     ,     8399880192,       99998575, Sat Jun 20 14:25:35 2015,/pcap/single?StreamName=remote_capture_reboot_1434777911130445056_20150620_1425&,/en.files.html?Fn=view&StreamName=remote_capture_reboot_1434777911130445056_20150620_1425&,
remote_capture_reboot_1434777685258077952_20150620_1421     ,     8399880192,       99998575, Sat Jun 20 14:21:49 2015,/pcap/single?StreamName=remote_capture_reboot_1434777685258077952_20150620_1421&,/en.files.html?Fn=view&StreamName=remote_capture_reboot_1434777685258077952_20150620_1421&,
remote_capture_reboot_1434777459172079104_20150620_1418     ,     8399880192,       99998575, Sat Jun 20 14:18:03 2015,/pcap/single?StreamName=remote_capture_reboot_1434777459172079104_20150620_1418&,/en.files.html?Fn=view&StreamName=remote_capture_reboot_1434777459172079104_20150620_1418&,
remote_capture_reboot_1434777233614947072_20150620_1414     ,     8399880192,       99998575, Sat Jun 20 14:14:17 2015,/pcap/single?StreamName=remote_capture_reboot_1434777233614947072_20150620_1414&,/en.files.html?Fn=view&StreamName=remote_capture_reboot_1434777233614947072_20150620_1414&,
remote_capture_reboot_1434777007262298880_20150620_1410     ,     8399880192,       99998575, Sat Jun 20 14:10:31 2015,/pcap/single?StreamName=remote_capture_reboot_1434777007262298880_20150620_1410&,/en.files.html?Fn=view&StreamName=remote_capture_reboot_1434777007262298880_20150620_1410&,
remote_capture_reboot_1434776760119515904_20150620_1406     ,     8399880192,       99998575, Sat Jun 20 14:06:24 2015,/pcap/single?StreamName=remote_capture_reboot_1434776760119515904_20150620_1406&,/en.files.html?Fn=view&StreamName=remote_capture_reboot_1434776760119515904_20150620_1406&,
remote_capture_reboot_1434776535094639104_20150620_1402     ,     8399880192,       99998575, Sat Jun 20 14:02:39 2015,/pcap/single?StreamName=remote_capture_reboot_1434776535094639104_20150620_1402&,/en.files.html?Fn=view&StreamName=remote_capture_reboot_1434776535094639104_20150620_1402&,
remote_capture_reboot_1434776309877481984_20150620_1358     ,     8399880192,       99998575, Sat Jun 20 13:58:54 2015,/pcap/single?StreamName=remote_capture_reboot_1434776309877481984_20150620_1358&,/en.files.html?Fn=view&StreamName=remote_capture_reboot_1434776309877481984_20150620_1358&,
remote_capture_reboot_1434776084655464960_20150620_1355     ,     8399880192,       99998575, Sat Jun 20 13:55:09 2015,/pcap/single?StreamName=remote_capture_reboot_1434776084655464960_20150620_1355&,/en.files.html?Fn=view&StreamName=remote_capture_reboot_1434776084655464960_20150620_1355&,
remote_capture_reboot_1434775857769832960_20150620_1351     ,     8399880192,       99998575, Sat Jun 20 13:51:22 2015,/pcap/single?StreamName=remote_capture_reboot_1434775857769832960_20150620_1351&,/en.files.html?Fn=view&StreamName=remote_capture_reboot_1434775857769832960_20150620_1351&,
remote_split_1434775647869_20150620_1347                    ,     8400142336,      100000000, Sat Jun 20 13:47:52 2015,/pcap/single?StreamName=remote_split_1434775647869_20150620_1347&,/en.files.html?Fn=view&StreamName=remote_split_1434775647869_20150620_1347&,
remote_reboot1434773930619883008_20150620_1319              ,     8400142336,      100000000, Sat Jun 20 13:19:15 2015,/pcap/single?StreamName=remote_reboot1434773930619883008_20150620_1319&,/en.files.html?Fn=view&StreamName=remote_reboot1434773930619883008_20150620_1319&,
remote_reboot1434773735263832064_20150620_1315              ,     8400142336,      100000000, Sat Jun 20 13:15:59 2015,/pcap/single?StreamName=remote_reboot1434773735263832064_20150620_1315&,/en.files.html?Fn=view&StreamName=remote_reboot1434773735263832064_20150620_1315&,
remote_reboot1434773540472738048_20150620_1312              ,     8400142336,      100000000, Sat Jun 20 13:12:44 2015,/pcap/single?StreamName=remote_reboot1434773540472738048_20150620_1312&,/en.files.html?Fn=view&StreamName=remote_reboot1434773540472738048_20150620_1312&,
remote_reboot1434773345743976960_20150620_1309              ,     8400142336,      100000000, Sat Jun 20 13:09:30 2015,/pcap/single?StreamName=remote_reboot1434773345743976960_20150620_1309&,/en.files.html?Fn=view&StreamName=remote_reboot1434773345743976960_20150620_1309&,
remote_reboot1434773148835964928_20150620_1306              ,     8400142336,      100000000, Sat Jun 20 13:06:13 2015,/pcap/single?StreamName=remote_reboot1434773148835964928_20150620_1306&,/en.files.html?Fn=view&StreamName=remote_reboot1434773148835964928_20150620_1306&,
remote_reboot1434772955000894976_20150620_1302              ,     8400142336,      100000000, Sat Jun 20 13:02:59 2015,/pcap/single?StreamName=remote_reboot1434772955000894976_20150620_1302&,/en.files.html?Fn=view&StreamName=remote_reboot1434772955000894976_20150620_1302&,
remote_reboot1434772759495929088_20150620_1259              ,     8400142336,      100000000, Sat Jun 20 12:59:44 2015,/pcap/single?StreamName=remote_reboot1434772759495929088_20150620_1259&,/en.files.html?Fn=view&StreamName=remote_reboot1434772759495929088_20150620_1259&,
remote_reboot1434772564984750080_20150620_1256              ,     8400142336,      100000000, Sat Jun 20 12:56:29 2015,/pcap/single?StreamName=remote_reboot1434772564984750080_20150620_1256&,/en.files.html?Fn=view&StreamName=remote_reboot1434772564984750080_20150620_1256&,
remote_reboot1434772368323953920_20150620_1253              ,     8400142336,      100000000, Sat Jun 20 12:53:12 2015,/pcap/single?StreamName=remote_reboot1434772368323953920_20150620_1253&,/en.files.html?Fn=view&StreamName=remote_reboot1434772368323953920_20150620_1253&,
remote_reboot1434772173499830016_20150620_1249              ,     8400142336,      100000000, Sat Jun 20 12:49:58 2015,/pcap/single?StreamName=remote_reboot1434772173499830016_20150620_1249&,/en.files.html?Fn=view&StreamName=remote_reboot1434772173499830016_20150620_1249&,
remote_reboot1434771978707971072_20150620_1246              ,     8400142336,      100000000, Sat Jun 20 12:46:43 2015,/pcap/single?StreamName=remote_reboot1434771978707971072_20150620_1246&,/en.files.html?Fn=view&StreamName=remote_reboot1434771978707971072_20150620_1246&,
Above is the example output that's clear and simple to parse. In this case we will select the stream "manual_capture_cli_20150620_1836" to download as a single file.
CLI: PCAP Download Single File
To download the capture "manual_capture_cli_20150620_1836" as a single PCAP use the following URL format
curl -u user:pass http://192.168.11.75/pcap/single?StreamName=InsertName > /capture/todays.pcap
For example to download the capture "manual_capture_cli_20150620_1836" in its entirety.
$ curl -u user:pass "http://192.168.11.75/pcap/single?StreamName=manual_capture_cli_20150620_1836" > /capture/todays.pcap

  % Total    % Received % Xferd  Average Speed   Time    Time     Time  Current
                                 Dload  Upload   Total   Spent    Left  Speed
 60 78.2G   60 47.3G    0     0  1010M      0  0:01:19  0:00:47  0:00:32 1024M

$
Notice the excellent download speed, that approaches the full 10Gbit management port capacity.
CLI: PCAP Split Download
To view all the split options for a capture use the following URL pattern
curl -u user:pass http://192.168.11.75/plain/view?StreamName=InsertName
For example the following request below shows all split options for the capture named "manual_capture_cli_20150620_1836"
$ curl -u user:pass "http://192.168.11.75/plain/view?StreamName=manual_capture_cli_20150620_1836"
SplitMode                     , Link
split_1sec                    , /plain/split?StreamName=manual_capture_cli_20150620_1836&StreamView=split_1sec
split_10sec                   , /plain/split?StreamName=manual_capture_cli_20150620_1836&StreamView=split_10sec
split_1min                    , /plain/split?StreamName=manual_capture_cli_20150620_1836&StreamView=split_1min
split_10min                   , /plain/split?StreamName=manual_capture_cli_20150620_1836&StreamView=split_10min
split_15min                   , /plain/split?StreamName=manual_capture_cli_20150620_1836&StreamView=split_15min
split_1hour                   , /plain/split?StreamName=manual_capture_cli_20150620_1836&StreamView=split_1hour
split_1GB                     , /plain/split?StreamName=manual_capture_cli_20150620_1836&StreamView=split_1GB
split_10GB                    , /plain/split?StreamName=manual_capture_cli_20150620_1836&StreamView=split_10GB
split_100GB                   , /plain/split?StreamName=manual_capture_cli_20150620_1836&StreamView=split_100GB
split_1TB                     , /plain/split?StreamName=manual_capture_cli_20150620_1836&StreamView=split_1TB
Where the first column is the split operation, and the second column is the URL to list the split files.
After deciding on the split mode, the following URL pattern is used to list all files.
curl -u user:pass http://192.168.11.75/plain/split?StreamName=InsertName&StreamView=InsertView
For example, extracting a list of 1 second splits from the capture named "manual_capture_cli_20150620_1836"
$ curl -u user:pass "http://192.168.11.75/plain/split?StreamName=manual_capture_cli_20150620_1836&StreamView=split_1sec"
Name                          ,     Size Bytes, Packet Count, URL
20150620_18:36:47.780.373.248 ,     1193017344,     14202589, /pcap/splittime?StreamName=manual_capture_cli_20150620_1836&Start=1434793007780373366ULL&Stop=1434793008780383914ULL
20150620_18:36:48.780.384.000 ,     1193279488,     14205708, /pcap/splittime?StreamName=manual_capture_cli_20150620_1836&Start=1434793008780383914ULL&Stop=1434793009780514262ULL
20150620_18:36:49.780.514.304 ,     1193017344,     14202588, /pcap/splittime?StreamName=manual_capture_cli_20150620_1836&Start=1434793009780514262ULL&Stop=1434793010780424945ULL
20150620_18:36:50.780.424.960 ,     1193279488,     14205708, /pcap/splittime?StreamName=manual_capture_cli_20150620_1836&Start=1434793010780424945ULL&Stop=1434793011780555292ULL
20150620_18:36:51.780.555.264 ,     1193017344,     14202587, /pcap/splittime?StreamName=manual_capture_cli_20150620_1836&Start=1434793011780555292ULL&Stop=1434793012780465900ULL
20150620_18:36:52.780.465.920 ,     1193017344,     14202588, /pcap/splittime?StreamName=manual_capture_cli_20150620_1836&Start=1434793012780465900ULL&Stop=1434793013780376583ULL
20150620_18:36:53.780.376.576 ,     1193279488,     14205708, /pcap/splittime?StreamName=manual_capture_cli_20150620_1836&Start=1434793013780376583ULL&Stop=1434793014780506931ULL
20150620_18:36:54.780.506.880 ,     1193017344,     14202587, /pcap/splittime?StreamName=manual_capture_cli_20150620_1836&Start=1434793014780506931ULL&Stop=1434793015780417554ULL
20150620_18:36:55.780.417.536 ,     1193279488,     14205708, /pcap/splittime?StreamName=manual_capture_cli_20150620_1836&Start=1434793015780417554ULL&Stop=1434793016780547901ULL
20150620_18:36:56.780.547.840 ,     1193017344,     14202588, /pcap/splittime?StreamName=manual_capture_cli_20150620_1836&Start=1434793016780547901ULL&Stop=1434793017780458591ULL
20150620_18:36:57.780.458.496 ,     1193279488,     14205708, /pcap/splittime?StreamName=manual_capture_cli_20150620_1836&Start=1434793017780458591ULL&Stop=1434793018780588947ULL
20150620_18:36:58.780.589.056 ,     1193017344,     14202587, /pcap/splittime?StreamName=manual_capture_cli_20150620_1836&Start=1434793018780588947ULL&Stop=1434793019780499570ULL
.
.
.
The above shows all split filenames of capture ""manual_capture_cli_20150620_1836" at 1 second split interval. To download a specific split, for example the 1 second capture at "20150620_18:36:58" use the link obtained above and issue the CURL get command shown below. In this example we`re piping the output into tcpdump via stdin.
$ curl -u user:pass "http://192.168.11.75/pcap/splittime?StreamName=manual_capture_cli_20150620_1836&Start=1434793018780588947ULL&Stop=1434793019780499570ULL" | ./tcpdump_ns -r - -nn

  % Total    % Received % Xferd  Average Speed   Time    Time     Time  Current
                                 Dload  Upload   Total   Spent    Left  Speed
100    24    0    24    0     0      2      0 --:--:--  0:00:08 --:--:--     0reading from file -, link-type EN10MB (Ethernet)
18:36:58.780.589.081 66:77:88:99:aa:bb > 00:33:33:33:33:33 Null Information, send seq 76, rcv seq 18, Flags [Command], length 54
18:36:58.780.589.163 66:77:88:99:aa:bb > 00:33:33:33:33:33 Null Information, send seq 82, rcv seq 18, Flags [Command], length 54
18:36:58.780.589.222 66:77:88:99:aa:bb > 00:33:33:33:33:33 Null Information, send seq 88, rcv seq 18, Flags [Command], length 54
18:36:58.780.589.297 66:77:88:99:aa:bb > 00:33:33:33:33:33 Null Information, send seq 94, rcv seq 18, Flags [Command], length 54
18:36:58.780.589.364 66:77:88:99:aa:bb > 00:33:33:33:33:33 Null Information, send seq 100, rcv seq 18, Flags [Command], length 54
18:36:58.780.589.438 66:77:88:99:aa:bb > 00:33:33:33:33:33 Null Information, send seq 106, rcv seq 18, Flags [Command], length 54
18:36:58.780.589.506 66:77:88:99:aa:bb > 00:33:33:33:33:33 Null Information, send seq 112, rcv seq 18, Flags [Command], length 54
18:36:58.780.589.573 66:77:88:99:aa:bb > 00:33:33:33:33:33 Null Information, send seq 118, rcv seq 18, Flags [Command], length 54
18:36:58.780.589.655 66:77:88:99:aa:bb > 00:33:33:33:33:33 Null Information, send seq 124, rcv seq 18, Flags [Command], length 54
Integration with your existing scripts and infrastructure is achieved using simple HTTP/HTTPS requests that are clean and easy to understand.
CLI Download: Summary
Quick summary of CLI download operations:
| Operation | URL |
| List Captures |
http://capture.sys.ip/plain/list
|
| Single file download |
http://capture.sys.ip/pcap/single?StreamName=InsertName
|
| List Capture`s various split`s |
http://capture.sys.ip/plain/view?StreamName=InsertName
|
| List Capture`s specific split file list |
http://capture.sys.ip/plain/split?StreamName=InsertName?StreamView=InsertView
|
PCAP File Upload
All FMADIO Packet capture systems can also uploaded raw PCAP files into the system. This allows Packetscope, Tcpscope and Analysis plugins to work on external and archived historical data. The upload functionality is heavily used internally for our own testing and regression frameworks.
Capturing must be stopped. Running Capture and Upload simultaneously results in undefined behavior
Upload Local PCAP
If the PCAP your uploading is small, you can
Step 1) scp the PCAP onto the OS disk. e.g. /mnt/store0/tmp2/
scp upload.pcap fmadio@192.168.1.1:/mnt/store0/tmp2/
Step 2) Upload using the utility stream_upload. The upload fetchs data via stdin allowing a wide range of options from a local PCAP file, to remote PCAP, to a curl URL or PCAP generation utility running on the system. The following example is a simple upload a PCAP thats on the local filesystem.
fmadio@fmadio20-049:/mnt/store0/tmp2$ cat hitcon_small.pcap | sudo stream_upload --name test_upload
FSPrefetch
FSPrefetch Chunk: 5000.184ms 5000ms
FSPrefetch Chunk timeoued: 5000.000ms max
create stream [test_upload_20170725_1625]
     0.178GB Uploaded
     0.610GB Uploaded
     0.864GB Uploaded
     1.116GB Uploaded
     1.335GB Uploaded
     1.472GB Uploaded
     1.667GB Uploaded
     1.793GB Uploaded
     1.947GB Uploaded
     2.225GB Uploaded
fmadio@fmadio20-049:/mnt/store0/tmp2$
Note: the timestamp resolution of the uploaded PCAP is automatically detected and converted to FMADIO native nanosecond format.
Step 3) Confirm upload.
fmadio@fmadio20-049:/mnt/store0/tmp2$ sudo stream_dump
Streams:
 [0000]    [this should be empty]      0GB Chunk(Cnt:       0 Start:       1 End:       0) Inv:-nan Cap:-nan CacheI:-nan Cache:-nan Disk:-nan Drop:-nan Pkt:0
 [0001] test_upload_20170725_1625      2GB Chunk(Cnt:    9341 Start:       8 End:    9348) Inv:0.000 Cap:0.000 CacheI:0.000 Cache:0.000 Disk:1.000 Drop:0.000 Pkt:10851045
Upload Remote PCAP
Sometimes you need to upload very large multi TB PCAP to the FMADIO Packet Capture System. In such cases there isn't enough local storage on the OS disk for the scp method to work. To upload a large PCAP use the streaming/pipe functionality of the stream_upload utility. In this example we are uploading a raw PCAP over SSH into the system. Starting with an SSH shell on the capture system the command SSH`s into the remote system where the PCAP is stored and issues a "cat" command on the PCAP to be uploaded. Effectively piping the remote PCAP down the ssh connection. This is then read by the stream_upload command in --stdin mode, instead of reading from the local file system. For maximum performance its best to use the 10G management port for the connection.
fmadio@fmadio20-049:~$ ssh remote_username@remote.ip.address.com cat path_to_pcap.pcap | sudo /opt/fmadio/bin/stream_upload --name remote_upload  --stdin
FSPrefetch
FSPrefetch Chunk: 5000.184ms 5000ms
FSPrefetch Chunk timeoued: 5000.000ms max
create stream [remote_upload_20170725_1625]
     0.178GB Uploaded
     0.610GB Uploaded
     0.864GB Uploaded
     1.116GB Uploaded
     1.335GB Uploaded
     1.472GB Uploaded
     1.667GB Uploaded
     1.793GB Uploaded
     1.947GB Uploaded
     2.225GB Uploaded
        .
        .
        .
        .
fmadio@fmadio20-049:~$
Using this approach the PCAP is streamed onto the system via SSH, with no temporarily files created. The maximum PCAP that can be uploaded is limited by the capture systems total storage capacity.
Packet Blaster
All Gen2+ FMADIO devices have a built in packet blaster / Layer 2 packet generator. This allows a single system to be entirely self contained for unit and system testing. In addition FMADIO devices can also load test network devices such as switching and firewalls, checking for physical layer links and measuring network path latency.
Packet blaster is a layer 2 (Ethernet level) packet generator that runs at full line rate @ 64B to 9218 Jumbo sized packets. Generation is performed entirely on the FPGA Capture card thus up to full 100Gbps @ 64B 148Mpps packets can be generated without generation variance. Packet generation and capture can run simultaneously, thus verification the capture device is operating correctly is achieved.
The payload of each packet is a per physical port MAC Address followed by a 32bit incrementally increasing sequence number. This sequence number is used later post capture to ensure data of all packets has been captured correctly without error. An example packet is shown in Wireshark below.

In the above wireshake picture, you can see 2 different MAC address 11:11:11:11:11:11 (Physical Port 1) and 22:22:22:22:22 (Physical Port 2). The payload is a 32bit little endian sequence numbers
0x11111111 (Per Physical Port MAC Address)
0x11111111 (Per Physical Port MAC Address)
0x11111111 (Per Physical Port MAC Address)
0x11111111 (Per Physical Port MAC Address)
0x11111111 (Per Physical Port MAC Address)

0xca560dc7 (Data payload Seq Number + 0)
0xca560dc8 (Data payload Seq Number + 1)
0xca560dc9 (Data payload Seq Number + 2)
0xca560dca (Data payload Seq Number + 3)
0xca560dcb (Data payload Seq Number + 4)
0xca560dcc (Data payload Seq Number + 5)
0xca560dce (Data payload Seq Number + 5)
0xca560dcf (Data payload Seq Number + 6)
0xca560dd0 (Data payload Seq Number + 7)
0xca560dd1 (Data payload Seq Number + 8)
0x313e49f0 (Frame Check Sequence)
This sequence number and MAC address allow the analysis software to not only check the total number of packets captured by the device, but also check every byte of the payload has been captured without error. As the analysis software knows exactly what the packet payload data should be via the sequence number.
Packet Blaster Operation
Packet blaster is operated only by the CLI interface, each FMAD SKU has a slightly different operation
FMADIO20v2
madio@fmadio20v2-149:~$ sudo stream_generate_f20 --blaster --help
Packet Gen: Sep 22 2019 01:05:06
stream_generate_f20 --blaster ::: FMADIO 20G Packet Blaster :::

Command line options:
  --pktsize      <packet size>     : Size of each packet (64-9218) Default 64B
  --pktcnt       <packet count>    : Total number of packets to generate. Scientific notation accepted
  --gbps         <data rate>       : Data rate to generate at, e.g. 5.0 Gbps (Default is 10G line rate)
  --port-enable  <port mask>       : Which ports to enable 0 is disable, 1 enable (Default is both ports 11)
  --zero-packet                    : Data payload set to Zero instead of sequence number
  --fcs-error                      : Generate FCS errors in the packet stream
fmadio@fmadio20v2-149:~$
Example operation, generate 1 billion(2 billion total) 64B packets simultaneously on both ports at full line 10G rate
fmadio@fmadio20v2-149:~$ sudo stream_generate_f20 --blaster --pktcnt 1e9 --pktsize 64 --port-enable 11
Packet Gen: Sep 22 2019 01:05:06
PktCnt: 1000000000
PktSize: 64
PortEnable: 1 1 0 0
Generate: PktSize:64 PktCnt:1000.000M Gbps:100.000000
Total dataidle bits: 2688.000000 b
TargetPkt Time: 26.879999ns per packet
DataPktTime   : 268.799988
Add extra     : -241.919983 ns
Pad Cycles    : -75
Final Wait    : 1
[     0] PacketGenConfig(RxCore, 0, 1,   1, 1, 0, 0, 0, 0x0, 0x0,0,  1, 0, 1, 0, 0, 0x0, 0x0, 0)
[     1] PacketGenConfig(RxCore, 0, 1,   1, 0, 0, 0, 0, 0x0, 0x0,128,  1, 0, 0, 0, 0, 0x0, 0x0, 129)
[     2] PacketGenConfig(RxCore, 0, 1,   1, 0, 0, 0, 0, 0x0, 0x0,130,  1, 0, 0, 0, 0, 0x0, 0x0, 131)
[     3] PacketGenConfig(RxCore, 0, 1,   1, 0, 0, 0, 0, 0x0, 0x1,0,  1, 0, 0, 0, 0, 0x0, 0x1, 0)
[     4] PacketGenConfig(RxCore, 0, 1,   1, 0, 0, 0, 0, 0x0, 0x1,0,  1, 0, 0, 0, 0, 0x0, 0x1, 0)
.
.
.
.
.
FMADIO100v2
fmadio@fmadio100v2-228:$ sudo ./stream_generate_f100 --blaster --help
Packet Gen: Oct  3 2019 18:44:18
stream_generate_f100 --blaster ::: FMADIO 100G Packet Blaster :::

Command line options:
  --pktsize      <packet size>    : Size of each packet (64-9218) Default 64B
  --pktcnt       <packet count>   : Total number of packets to generate. Scientific notation accepted
  --gbps         <data rate>      : Data rate to generate at, e.g. 50.0 Gbps (Default is 100G line rate)
  --port-enable  <port mask>      : Which ports to enable 0 is disable, 1 enable (Default is single port 01)

fmadio@fmadio100v2-228:$
Example operation, generate 1 billion 64B packets on a single 100G port at full line rate
fmadio@fmadio100v2-228:$ sudo ./stream_generate_f100 --blaster --pktcnt 1e9 --pktsize 64 --port-enable 01
Packet Gen: Oct  3 2019 18:44:18
PktCnt: 1000000000
PktSize: 64
PortEnable: 0 1
Generate: PktSize:64 PktCnt:1000.000M Gbps:100.000000
GenConfig(0, 1,  1, 1, 0, 0x0, 0x4,  1, 0, 0, 0x0, 0x4,  1, 0, 0, 0x0, 0x4,  1, 0, 1, 0x0, 0x4)
GenConfig(0, 1,  1, 1, 0, 0x0, 0x4,  1, 0, 0, 0x0, 0x4,  1, 0, 0, 0x0, 0x4,  1, 0, 1, 0x0, 0x4)
GenConfig(0, 1,  1, 1, 0, 0x0, 0x4,  1, 0, 0, 0x0, 0x4,  1, 0, 0, 0x0, 0x4,  1, 0, 1, 0x0, 0x4)
GenConfig(0, 1,  1, 1, 0, 0x0, 0x4,  1, 0, 0, 0x0, 0x4,  1, 0, 0, 0x0, 0x4,  1, 0, 1, 0x0, 0x4)
GenConfig(0, 1,  1, 1, 0, 0x0, 0x4,  1, 0, 0, 0x0, 0x4,  1, 0, 0, 0x0, 0x4,  1, 0, 1, 0x0, 0x4)
GenConfig(0, 1,  1, 1, 0, 0x0, 0x4,  1, 0, 0, 0x0, 0x4,  1, 0, 0, 0x0, 0x4,  1, 0, 1, 0x0, 0x4)
GenConfig(0, 1,  1, 1, 0, 0x0, 0x4,  1, 0, 0, 0x0, 0x4,  1, 0, 0, 0x0, 0x4,  1, 0, 1, 0x0, 0x4)
GenConfig(0, 1,  1, 1, 0, 0x0, 0x4,  1, 0, 0, 0x0, 0x4,  1, 0, 0, 0x0, 0x4,  1, 0, 1, 0x0, 0x4)
GenConfig(0, 1,  1, 1, 0, 0x0, 0x4,  1, 0, 0, 0x0, 0x4,  1, 0, 0, 0x0, 0x4,  1, 0, 1, 0x0, 0x4)
GenConfig(0, 1,  1, 1, 0, 0x0, 0x4,  1, 0, 0, 0x0, 0x4,  1, 0, 0, 0x0, 0x4,  1, 0, 1, 0x0, 0x4)
Config Length: 40
TargetPkt Time: 51.200001ns per packet
DataPktTime   : 51.200001
Add extra     : 0.000000 ns
Pad Cycles    : 0
Final Wait    : 1
PortMode: 0 1
update 191 35712 0.000000 : 03010122
update 14212540 909614080 72.734941 : 05000134
update 28424336 1819170048 145.459036 : 05000134
update 42635968 2728713536 218.187497 : 05000134
update 56842067 3637903488 290.999828 : 05000134
update 71052937 4547399168 363.629380 : 05000134
update 85262420 5456806464 436.391969 : 03010122
update 99468647 6366004608 509.219176 : 03010122
.
.
.
.
Data Verification
Payload data verification on the device is achieved by "linux-cat-ing" a capture down a linux pipe to the builtin utility capinfos2. The syntax looks as follows
FMADIO20v2:
fmadio@fmadio20v2-149:~$ sudo stream_cat --ignore_fcs <capture name> | capinfos2 -v -seq --with-fcs
PCAP nano
0.00GB    0.000 Gbps    0.000 Mpps
0.42GB    3.344 Gbps    5.225 Mpps
0.80GB    3.048 Gbps    4.763 Mpps
1.20GB    3.168 Gbps    4.950 Mpps
1.60GB    1.618 Gbps    2.528 Mpps

packet stream end
SUCCESS

Total Packets  : 20000000
TotalBytes     : 1280000000
TotalPackets   : 20000000
PayloadCRC     : b967a1590a5a2c2
ErrorSeq       : 0
ErrorPktSize   : 0
LastByte       : 0x00000000
SeqStart       : 0x00000000 0x00000000 0x00000000 0x00000000 : 0x00000000
SeqEnd         : 0x00000000 0x00000000 0x00000000 0x00000000 : 0x00000000
PacketCnt      : 0 0 0 0
TimeOrder      : 0
CRCFail        : 0
TotalPCAPTime  : 0 ns
Bandwidth      : 14.883 Gbps
Packet Rate    : 29.069 Mpps

Complete
fmadio@fmadio20v2-149:~$
FMADIO100v2:
fmadio@fmadio100v2-228:$ sudo stream_cat --ignore_fcs <capture name>| capinfos2  -v --seq --with-fcs --disable-portid
No PortID
PCAP nano
Port:4 new seq: af000000 Packets: 0 Length:  68
0.00GB    0.000 Gbps    0.000 Mpps
0.33GB    2.584 Gbps    3.845 Mpps
0.74GB    3.295 Gbps    4.903 Mpps
1.09GB    2.831 Gbps    4.213 Mpps
1.40GB    2.487 Gbps    3.701 Mpps
1.78GB    3.034 Gbps    4.514 Mpps
2.15GB    2.932 Gbps    4.363 Mpps
2.50GB    2.816 Gbps    4.191 Mpps
2.82GB    2.556 Gbps    3.804 Mpps
3.23GB    3.260 Gbps    4.852 Mpps
3.59GB    2.893 Gbps    4.305 Mpps
3.90GB    2.487 Gbps    3.701 Mpps
4.26GB    2.877 Gbps    4.281 Mpps
4.56GB    2.362 Gbps    3.514 Mpps
4.86GB    2.439 Gbps    3.629 Mpps
5.16GB    2.385 Gbps    3.549 Mpps
5.47GB    2.434 Gbps    3.622 Mpps
5.87GB    3.221 Gbps    4.793 Mpps
6.17GB    2.406 Gbps    3.581 Mpps
6.59GB    3.306 Gbps    4.920 Mpps
6.95GB    2.859 Gbps    4.254 Mpps
7.29GB    2.705 Gbps    4.025 Mpps
7.63GB    2.773 Gbps    4.126 Mpps
7.99GB    2.862 Gbps    4.259 Mpps
8.35GB    2.883 Gbps    4.290 Mpps
packet stream end
SUCCESS
8.40GB    0.321 Gbps    0.478 Mpps
Total Packets  : 100000000
TotalBytes     : 6800000000
TotalPackets   : 100000000
PayloadCRC     : 4791a6a7add60780
ErrorSeq       : 0
ErrorPktSize   : 0
LastByte       : 0x0e5e0fff
SeqStart       : 0x00000000 0x00000000 0x00000000 0x00000000 : 0xaf000000
SeqEnd         : 0x00000000 0x00000000 0x00000000 0x00000000 : 0x0e5e0fff
PacketCnt      : 0 0 0 0
TimeOrder      : 0
CRCFail        : 0
TotalPCAPTime  : 0 ns
Bandwidth      : 77.273 Gbps
Packet Rate    : 142.045 Mpps

Complete
fmadio@fmadio100v2-228:$
Replay Management Port
Replaying captured data on the management 10G/40G/100G management interface is one option. Typically this is used for capturing data in one location (for example a Production Network) and replaying it in a different location (Lab network). This allows more in-depth debugging of a device under test in a Lab setting. Alternatively data can also be replayed to devices and systems that do not accept PCAP data, but instead only support ingress data on a physical ethernet port.
The replay on management interface is not a high performance / high accuracy replay device. It uses the standard tool tcpreplay which is familiar and widely used. This allows a familiar toolset to be used with the FMADIO Capture Replay devices that is quick to learn and operate.
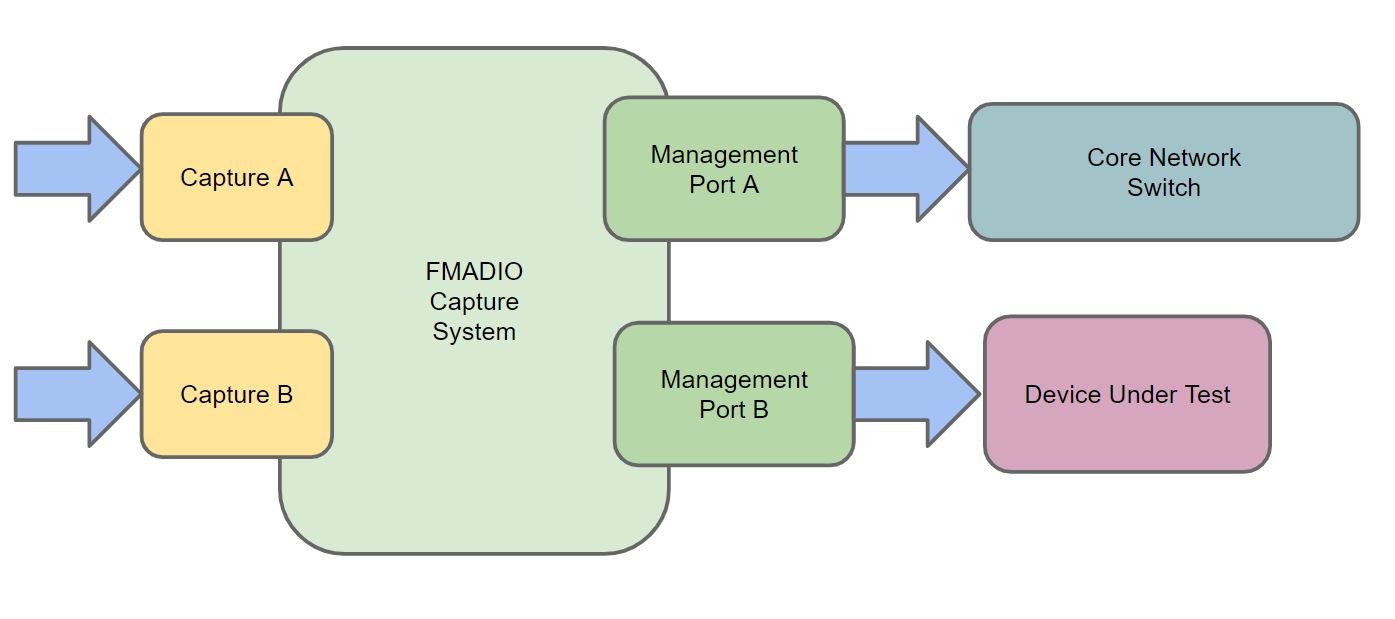
In the above topology, data is captured on the high speed 10G/40G/100G Capture ports A & B, Management port A is used for SSH/Web/General access to the capture device, and Management Port B is attached directly to the DUT(Device Under Test). This direct physical connection from man11 port (Management Port B) to the DUT allows tcpreplay to output directly to man11 thus data goes directly to the DUT without any switching or routing in between.
Program operation
First find the capture file to be replayed using the stream_dump command on the command line
fmadio@fmadio100v2-228:$ sudo stream_dump
Streams:
 [0000]    [this should be empty]      0GB Chunk(Cnt:       0 Start:       1 End:       0 Comp:0.00) Inv:-nan Cap:-nan CacheI:-nan Cache:-nan Disk:-nan Drop:-nan Pkt:0
 [0001]         tst_20190801_1604      0GB Chunk(Cnt:      55 Start:   29145 End:   29199 Comp:0.00) Inv:-nan Cap:-nan CacheI:-nan Cache:-nan Disk:-nan Drop:-nan Pkt:0
   .
   .
   .
 [0302] flow_IMIX_1M_20191003_2024 8GB Chunk(Cnt:   35720 Start: 4759088 End: 4794807 Comp:0.00) Inv:-nan Cap:-nan CacheI:-nan Cache:-nan Disk:-nan Drop:-nan Pkt:0

   .
   .
   .

Capture Size   :             2086 GB (1.0000%)
Physical Size  :             2086 GB
Maximum  Size  :             2240 GB
Compress Ratio :           0.0005 %
Cache Cnt      :                8 x    280 GB (  2241 GB)
Store Cnt      :                8 x    280 GB (  2240 GB)
ECC Cnt        :                1 x    280 GB

Next Cache     :          7271104 :          8546904
Next Store     :                0 :          2136704
Next Chunk     :          7272952 :          8546816

Validate Enable:                0
Validate Offset:                0
Validate Size  :                0 (0.00GB)
fmadio@fmadio100v2-228:$
In the above example we want to replay the capture flow_IMIX_1M_20191003_2024 which is a PCAP with 1M unique flows with an IMIX packet size distribution. On the 10G Management Port B (phy11 or man11).
NOTE: don't forget the trailing "-" as this specifies the input PCAP is via stdin (which is provided by stream_cat)
NOTE: MTU setting on phy11 may need to changed, e.g. sudo ifconfig phy11 mtu 9218 or changed permenatnly.
fmadio@fmadio100v2-228:$ sudo stream_cat --ignore_fcs flow_IMIX_1M_20191003_2024 | sudo tcpreplay -i phy11  --stats=1   -
stream_cat ioqueue: 4
StartChunkID: 4759088
Test start: 2019-10-04 13:49:07.625570 ...
Actual: 77574 packets (715232280 bytes) sent in 1.00 seconds
Rated: 715190798.9 Bps, 5721.52 Mbps, 77569.50 pps
Actual: 155500 packets (1433710000 bytes) sent in 2.00 seconds
Rated: 716855000.0 Bps, 5734.84 Mbps, 77750.00 pps
Actual: 279758 packets (2579368760 bytes) sent in 3.00 seconds
Rated: 859789586.6 Bps, 6878.31 Mbps, 93252.66 pps
Actual: 351827 packets (3243844940 bytes) sent in 4.00 seconds
Rated: 810961235.0 Bps, 6487.68 Mbps, 87956.75 pps
Actual: 423219 packets (3902079180 bytes) sent in 5.00 seconds
Rated: 780415836.0 Bps, 6243.32 Mbps, 84643.80 pps
Actual: 498218 packets (4593569960 bytes) sent in 6.00 seconds
Rated: 765594993.3 Bps, 6124.75 Mbps, 83036.33 pps
Actual: 575036 packets (5301831920 bytes) sent in 7.00 seconds
Rated: 757404560.0 Bps, 6059.23 Mbps, 82148.00 pps
Actual: 651761 packets (6009236420 bytes) sent in 8.00 seconds
Rated: 751154552.5 Bps, 6009.23 Mbps, 81470.12 pps
Actual: 729792 packets (6728682240 bytes) sent in 9.00 seconds
Rated: 747631360.0 Bps, 5981.05 Mbps, 81088.00 pps
Actual: 807828 packets (7448174160 bytes) sent in 10.00 seconds
Rated: 744817416.0 Bps, 5958.53 Mbps, 80782.80 pps
Actual: 885640 packets (8165600800 bytes) sent in 11.00 seconds
Rated: 742327345.4 Bps, 5938.61 Mbps, 80512.72 pps
Actual: 963816 packets (8886383520 bytes) sent in 12.00 seconds
Rated: 740531960.0 Bps, 5924.25 Mbps, 80318.00 pps
packet stream end
SUCCESS
Test complete: 2019-10-04 13:49:20.089734
Actual: 1000000 packets (9220000000 bytes) sent in 12.46 seconds
Rated: 739730423.6 Bps, 5917.84 Mbps, 80231.06 pps
Statistics for network device: phy11
        Successful packets:        1000000
        Failed packets:            0
        Truncated packets:         0
        Retried packets (ENOBUFS): 0
        Retried packets (EAGAIN):  0
fmadio@fmadio100v2-228:/mnt/store0/develop_20191003_rc2/stream_generate_f100$
In the above example its replaying the pcap at just under ~6Gbps. Its not ideal however for full nano second replay function requires our internal packet replay toolchain.
Replay while Capturing
FMADIO can replay PCAP traffic at low speed while simultaneously capturing at full line rate. This can be very helpful for debugging or other troubleshooting and does not require changing the FPGA firmware from Capture to Replay mode. This Replay mode uses PIO (Programmed IO) who's bandwidth is quite low, and is not suitable for full high bandwidth packet relay. Usage is as follows
FMADIO20G (Gen2/Gen3)
Example command on the 20G Packet Capture system
Command:
/opt/fmadio/bin/stream_generate_f20 --replay
Example below pipes a PCAP previously captured on the device back down the the capture interfaces.
fmadio@fmadio20v2-149:~$ sudo stream_cat --ignore_fcs test64_20191004_1151 | sudo stream_generate_f20 --replay
Packet Gen: Sep 22 2019 01:05:06
stream_cat ioqueue: 4
SetAffinity: CPU 30 Index:16
StartChunkID: 8994
PCAP Nano
Replay Pkts:         1 Drop:         0 Total:0.000GB 0.396Gbps
Replay Pkts:    649312 Drop:         0 Total:0.042GB 0.332Gbps
Replay Pkts:   1299210 Drop:         0 Total:0.083GB 0.333Gbps
Replay Pkts:   1949573 Drop:         0 Total:0.125GB 0.333Gbps
Replay Pkts:   2599309 Drop:         0 Total:0.166GB 0.333Gbps
Replay Pkts:   3249180 Drop:         0 Total:0.208GB 0.333Gbps
Replay Pkts:   3899671 Drop:         0 Total:0.250GB 0.333Gbps
Replay Pkts:   4549914 Drop:         0 Total:0.291GB 0.333Gbps
Replay Pkts:   5199871 Drop:         0 Total:0.333GB 0.333Gbps
Replay Pkts:   5828751 Drop:         0 Total:0.373GB 0.332Gbps
Replay Pkts:   6478494 Drop:         0 Total:0.415GB 0.332Gbps
Replay Pkts:   7128289 Drop:         0 Total:0.456GB 0.332Gbps
Replay Pkts:   7777780 Drop:         0 Total:0.498GB 0.332Gbps
Replay Pkts:   8425123 Drop:         0 Total:0.539GB 0.332Gbps
Replay Pkts:   9074288 Drop:         0 Total:0.581GB 0.332Gbps
Replay Pkts:   9723647 Drop:         0 Total:0.622GB 0.332Gbps
Replay Pkts:  10379903 Drop:         0 Total:0.664GB 0.332Gbps
Replay Pkts:  11029807 Drop:         0 Total:0.706GB 0.332Gbps
Replay Pkts:  11679917 Drop:         0 Total:0.748GB 0.332Gbps
Replay Pkts:  12327988 Drop:         0 Total:0.789GB 0.332Gbps
Replay Pkts:  12977595 Drop:         0 Total:0.831GB 0.332Gbps
Replay Pkts:  13629543 Drop:         0 Total:0.872GB 0.332Gbps
Replay Pkts:  14285072 Drop:         0 Total:0.914GB 0.332Gbps
Replay Pkts:  14928107 Drop:         0 Total:0.955GB 0.332Gbps
Replay Pkts:  15575152 Drop:         0 Total:0.997GB 0.332Gbps
Replay Pkts:  16222518 Drop:         0 Total:1.038GB 0.332Gbps
Replay Pkts:  16871634 Drop:         0 Total:1.080GB 0.332Gbps
Replay Pkts:  17521499 Drop:         0 Total:1.121GB 0.332Gbps
Replay Pkts:  18177284 Drop:         0 Total:1.163GB 0.332Gbps
Replay Pkts:  18823901 Drop:         0 Total:1.205GB 0.332Gbps
Replay Pkts:  19472977 Drop:         0 Total:1.246GB 0.332Gbps
packet stream end
SUCCESS
STDIN Read fail: 0
Replay Pkts:  20000000 Drop:         0 Total:1.280GB 0.322Gbps
fmadio@fmadio20v2-149:~$
FMADIO 100G (Gen2)
Command is
PCAP linux stdin pipe | sudo /opt/fmadio/bin/stream_generate_f100 --replay_pio
You can pipe a PCAP from a local file system or use stream_cat to pipe from the capture system. Example below pipes from a previous captures.
fmadio@fmadio100v2-228:$ sudo stream_cat --ignore_fcs testk9k_b_20200727_0106 | sudo ./stream_generate_f100  --replay_pio

Packet Gen: Jul 27 2020 00:24:51
map 0x7f73115e0000
0x7f7308c4a000
StartChunk: 3856856
PCAP Nano
Replay Pkts:         1 Drop:         0 Total:0.000GB 0.579Gbps
Replay Pkts:     40225 Drop:         0 Total:0.056GB 0.451Gbps
Replay Pkts:     80542 Drop:         0 Total:0.113GB 0.451Gbps
Replay Pkts:    120730 Drop:         0 Total:0.169GB 0.451Gbps
Replay Pkts:    160842 Drop:         0 Total:0.225GB 0.450Gbps
Replay Pkts:    200879 Drop:         0 Total:0.281GB 0.450Gbps
Replay Pkts:    240992 Drop:         0 Total:0.337GB 0.450Gbps
Replay Pkts:    281222 Drop:         0 Total:0.394GB 0.450Gbps
Replay Pkts:    321452 Drop:         0 Total:0.450GB 0.450Gbps
Replay Pkts:    361580 Drop:         0 Total:0.506GB 0.450Gbps
Replay Pkts:    401815 Drop:         0 Total:0.563GB 0.450Gbps
Replay Pkts:    442053 Drop:         0 Total:0.619GB 0.450Gbps
Replay Pkts:    482276 Drop:         0 Total:0.675GB 0.450Gbps
Replay Pkts:    522380 Drop:         0 Total:0.731GB 0.450Gbps
Replay Pkts:    562478 Drop:         0 Total:0.787GB 0.450Gbps
Replay Pkts:    602678 Drop:         0 Total:0.844GB 0.450Gbps
Replay Pkts:    642979 Drop:         0 Total:0.900GB 0.450Gbps
Replay Pkts:    683165 Drop:         0 Total:0.956GB 0.450Gbps
Replay Pkts:    723334 Drop:         0 Total:1.013GB 0.450Gbps
Replay Pkts:    763528 Drop:         0 Total:1.069GB 0.450Gbps
Replay Pkts:    803801 Drop:         0 Total:1.125GB 0.450Gbps
Replay Pkts:    843917 Drop:         0 Total:1.181GB 0.450Gbps
Replay Pkts:    884163 Drop:         0 Total:1.238GB 0.450Gbps
Replay Pkts:    924157 Drop:         0 Total:1.294GB 0.450Gbps
.
.
.
.
The following example pipes a PCAP on the localfile system (/mnt/store0/tmp/imix.pcap) to replay the traffic
fmadio@fmadio100v2-228$ cat imix10.pcap | sudo stream_generate_f100  --replay_pio

Packet Gen: Jul 28 2020 01:05:12
SetAffinity: CPU 1 Index:18
PCAP Nano
Replay Pkts:         1 Drop:         0 Total:0.000GB 0.506Gbps
Replay Pkts:    137652 Drop:         0 Total:0.049GB 0.389Gbps
Replay Pkts:    273955 Drop:         0 Total:0.097GB 0.390Gbps
Replay Pkts:    411187 Drop:         0 Total:0.146GB 0.391Gbps
Replay Pkts:    548794 Drop:         0 Total:0.196GB 0.391Gbps
Replay Pkts:    686374 Drop:         0 Total:0.244GB 0.391Gbps
Replay Pkts:    822256 Drop:         0 Total:0.293GB 0.390Gbps
Replay Pkts:    955237 Drop:         0 Total:0.340GB 0.389Gbps
Replay Pkts:   1092409 Drop:         0 Total:0.389GB 0.389Gbps
Replay Pkts:   1227813 Drop:         0 Total:0.437GB 0.389Gbps
Replay Pkts:   1361926 Drop:         0 Total:0.485GB 0.388Gbps
Replay Pkts:   1498830 Drop:         0 Total:0.534GB 0.388Gbps
Replay Pkts:   1634867 Drop:         0 Total:0.582GB 0.388Gbps
Replay Pkts:   1771895 Drop:         0 Total:0.631GB 0.388Gbps
Replay Pkts:   1907879 Drop:         0 Total:0.680GB 0.388Gbps
Replay Pkts:   2039344 Drop:         0 Total:0.726GB 0.387Gbps
Replay Pkts:   2176207 Drop:         0 Total:0.775GB 0.388Gbps
Replay Pkts:   2310531 Drop:         0 Total:0.823GB 0.387Gbps
Replay Pkts:   2446486 Drop:         0 Total:0.871GB 0.387Gbps
Replay Pkts:   2583970 Drop:         0 Total:0.921GB 0.388Gbps
Replay Pkts:   2722008 Drop:         0 Total:0.970GB 0.388Gbps
Replay Pkts:   2859852 Drop:         0 Total:1.019GB 0.388Gbps
Replay Pkts:   2997241 Drop:         0 Total:1.068GB 0.388Gbps
Replay Pkts:   3134724 Drop:         0 Total:1.117GB 0.388Gbps
.
.
.
.
Generating Replay PCAP
One the massive benefits of a full line rate PCAP replay feature is, you can generate PCAPs at any speed, upload them to the FMAD Packet Replay Device and then replay them at any speed you required. There are many ways to generate PCAP files for replay, we will use our builtin utility pcap_genflow ( https://github.com/fmadio/pcap_genflow however many other tools such as tcpreplay, iperf3 and others which can output to a PCAP file for upload.
Step 1) is to generate the PCAP using various toolchains.
Step 2) Upload the PCAP into the FMADIO Capture System
Step 3) Replay the capture at any speed
Generate PCAP File
Some example using pcap_genflow as follows
Generate 1 billion packets, with 1M unique TCP flows using 64B packets @ 100Gbps
$ ./pcap_genflow --pktcnt 1e9 --pktsize 64 --flowcnt 1e6 --bps 100e9 > flow_1M_64B_100G.pcap
Generate 100M packets, with 1M unique TCP flows using 1500B packets @ 100Gbps
$ ./pcap_genflow --pktcnt 100e6 --pktsize 1500 --flowcnt 1e6 --bps 100e9 > flow_1M_1500B_100G.pcap
Generate 100M packets, with 1M unique TCP flows using IMIX packet size distribution @ 100Gbps
$ ./pcap_genflow --pktcnt 100e6 --imix --flowcnt 1e6 --bps 100e9 > flow_1M_IMIX_100G.pcap
Uploading PCAP File
Typically when generating PCAP files the output is written to a linux pipe, the FMAD PCAP File upload function always reads PCAPs from stdin. The tool to upload PCAP into the FMAD capture system is stream_upload. The syntax is
fmadio@fmadio100v2-228:$ sudo ./stream_upload --help
Stream Upload V3: Oct 4 2019 20:00:10
Stream Uploader V3
--------------------------
uploader always reads from stdin
stream_upload
Example of uploading the previously generated file flow_1M_IMIX_100G.pcap. PCAP can be scp to the device, or streamed over an SSH connection
$ cat flow_1M_IMIX_100G.pcap | sudo stream_upload --name flow_1M_IMIX_100G
Or this can be generated via on the FMADIO device itself, by piping the output of pcap_genflow directly to stream_upload
$ ./pcap_genflow --pktcnt 100e6 --imix --flowcnt 1e6 --bps 100e9 | sudo stream_upload --name flow_1M_IMIX_100G
Replay PCAP File
Once the PCAP has been uploaded into the capture system, it can be replayed with various options as discussed here. It should be clear PCAP Generation + Upload + Replay is a powerful tool for any Network Engineer. If you have suggestions or questions feel free to contact us.
Packet Filtering
For post capture analysis, Filter blocks and Filter Expressions enable complex and almost arbitrary filtering capabilities. We separate filtering into simple per packet "Filter Blocks", for example Is the packet UDP? which are combined into more complicated "Filter Expressions". This enables you to chain and build complex filter expressions based on your requirements.
Simple Filter
Starting with a very simple filter, "Extract all TCP packets" we build in the following way.
Step 1)
Enter the filter expression "ipv4.proto == tcp" in the filter block highlighted in green below. After pressing enter the display will look like the image below.
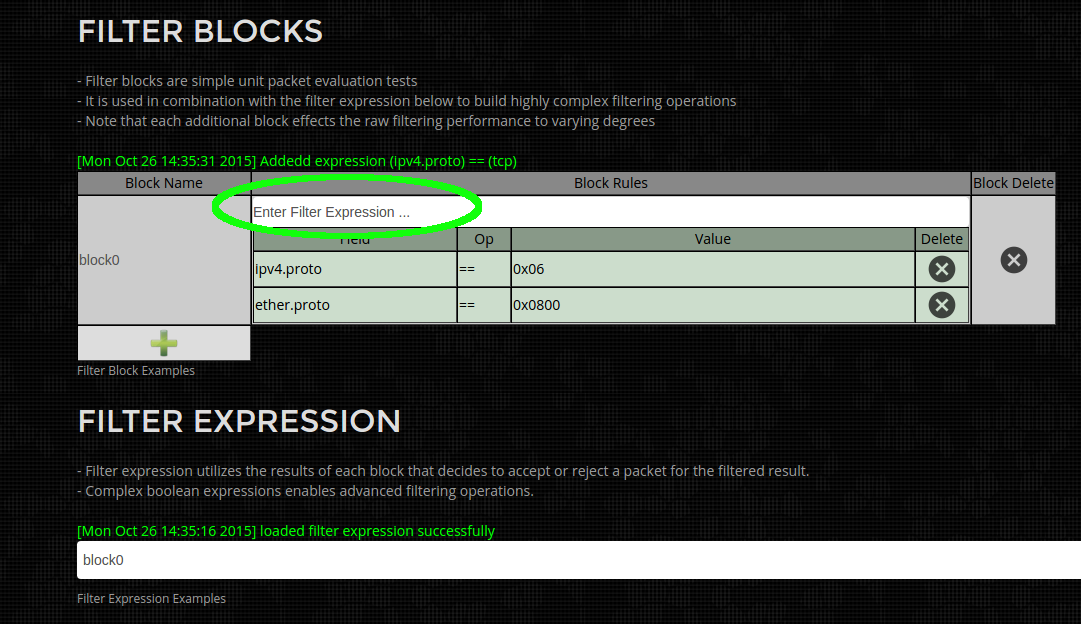
Step 2) Rename the Filter Expression to "all_tcp" by clicking on and editing the text in the area highlighted in green below. This improves readability but for simple filters it is excessive and not required.
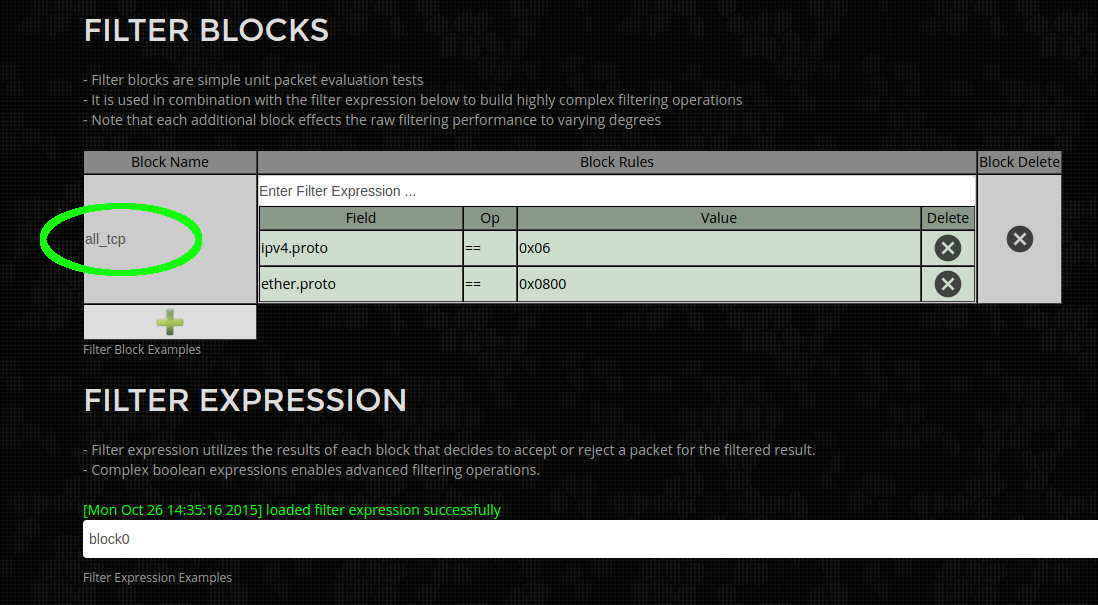
Step 3) Update the filter expression by clicking and editing the area highlighted in green below to reference the newly named "all_tcp" Filter Block. For simple filters the default values of "block0" can be used.
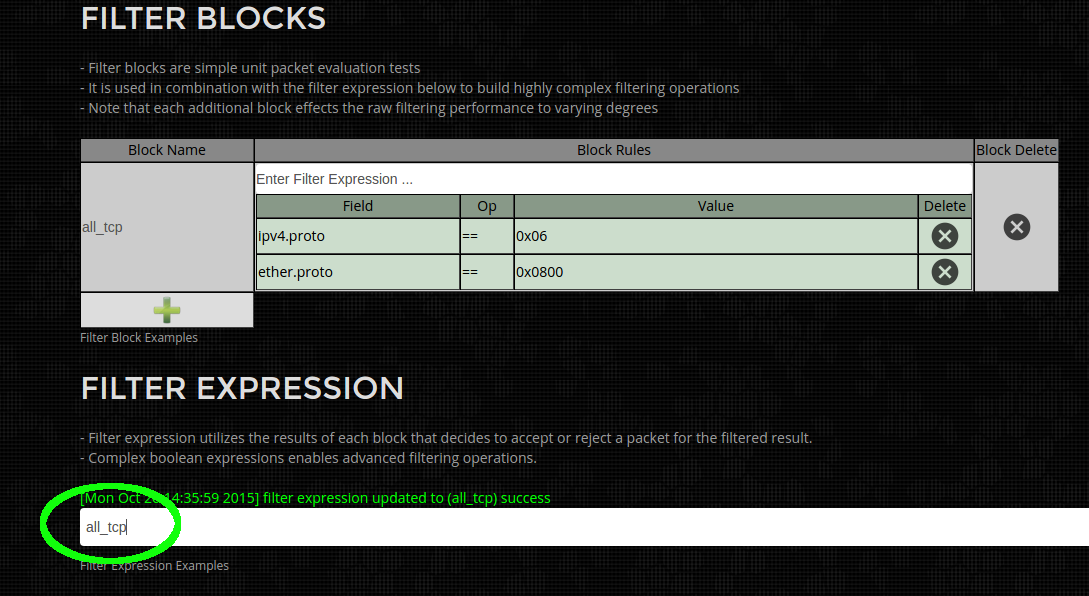
Step 4)
Run packet Analysis or Download to PCAP by selecting on the appropriate icons as shown below. (shown below is green to run analysis, blue to download as PCAP)
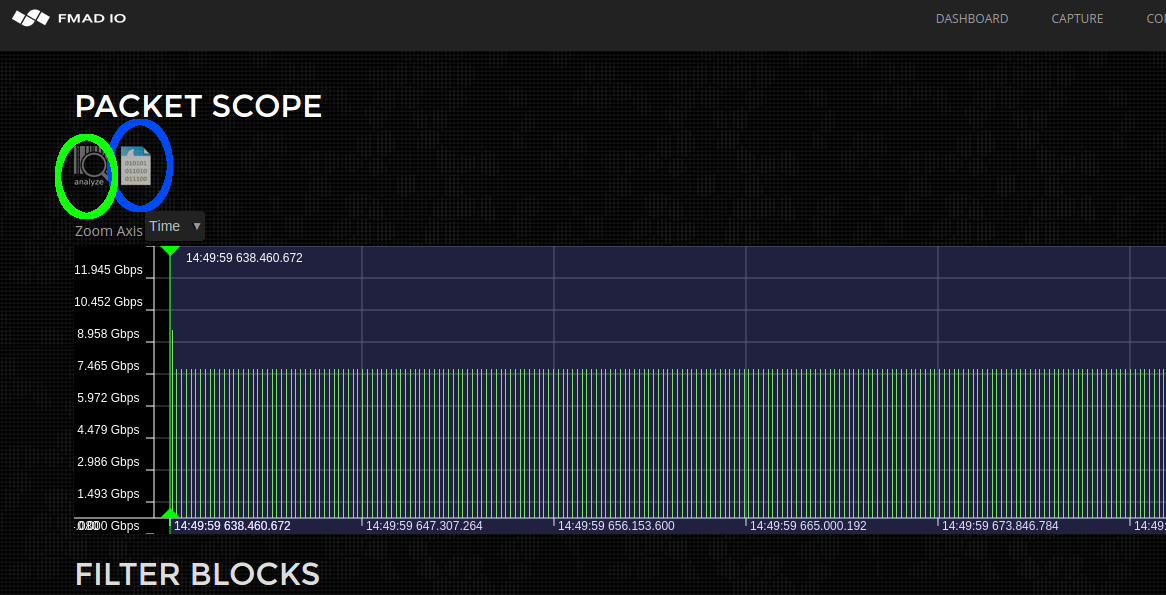
Below is a quick list of example filters currently supported. If you require additional filters please let us know.
| ether.proto == ipv4 | select all IPv4 traffic |
| ether.addr == 00:ba:be: | select all ethernet mac address starting with wild card 00:ba:be:*:*:* |
| ether.addr == 00:ba:be:11:22:33 | select all packets with exact mac address (src or dest) of 00:ba:be:11:22:33 |
| ether.addr == 00:* | select all packets with wildcard mac address (src or dest) |
| ether.fcs == fail | select all packets with invalid ethernet frame FCS |
| ipv4.addr == 192.168.1.1 | select all ipv4 packets with address of 192.168.1.1 |
| ipv4.addr == 192.168.1.0/24 | select all ipv4 packets on subnet 192.168.1.0/24 |
| ipv4.addr.src == 192.168.1.0/24 | select all ipv4 packets whose source address is on subnet 192.168.1.0/24 |
| ipv4.proto == tcp | select all ipv4 TCP packets |
| ipv4.proto == udp | select all ipv4 UDP packets |
| ipv4.proto == icmp | select all ipv4 ICMP packets |
| ipv4.proto == igmp | select all ipv4 IGMP packets |
| tcp.port == 1000 | select all tcp traffic with port number 1000 |
| tcp.port == 1000-2000 | select all tcp traffic with port number range from 1000 to 2000 |
| tcp.port.src == 1000 | select all tcp traffic with source port number 1000 |
| udp.port == 3000 | select all udp traffic with port number 3000 |
| udp.port == 3000-4000 | select all udp traffic with port number range from 3000 to 4000 |
| udp.port.src == 3000 | select all udp traffic with source port number 3000 |
| frame.time == 20141225_08:00:00.100.200.300 | select all packets after the date 2014 12(Dec) 25th from 8:00:00.100.200.300 |
| frame.time == 20141225_08:00:00.100.200.300-20141225_17:00:00.400.500.600 | select all packets after the date 2014 12(Dec) 25th from 8:00:00.100.200.300 but before 2014 12(Dec) 25th at 17:00:00.400.500.600 |
| frame.time == 07:00:00 | select all packets after todays date at 07:00:00am |
| frame.size <= 128 | select all packets less than or equal to 128 bytes in length |
| frame.size >= 1024 | select all packets greater than or equal to 1024 bytes in length |
| frame.size == 64 | select all packets equal to 64 bytes in length |
| vlan.id == 1234 | select vlan tag id 1234 |
Complex Filters
Complex filters are possible by combining multiple Filter Blocks using Filter Expressions. The system parses simple boolean logic expression which references Filter blocks specified above.
Example Filter (Simple):
Simple One block expression to match all ethernet MAC address(effectively no filtering). Edit the filter Block name (in green below) to "default" and replacing the Filter Expression (in blue below) to "default".
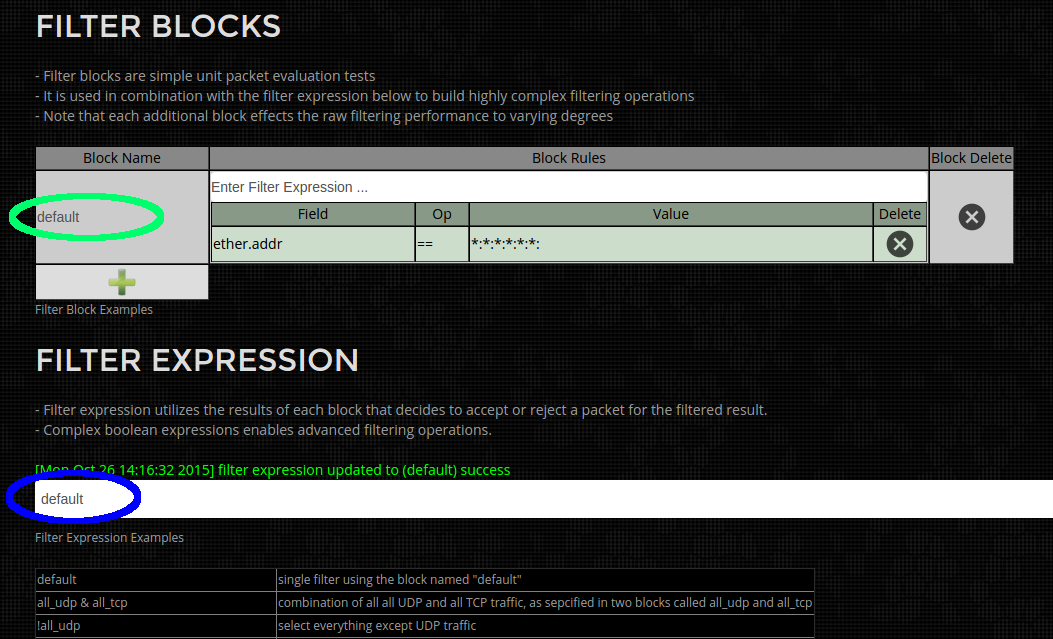
Example Filter (UDP and TCP traffic):
This is a 2 block filter, where the first block "all_udp" (in Green below) selects all UDP packets. The second block "all_tcp" (in green below) selects all TCP packets. And the Filter expression (in blue below) selects "all_udp" packets OR "all_tcp" packets. Net result is filtering for either TCP or UDP packets.
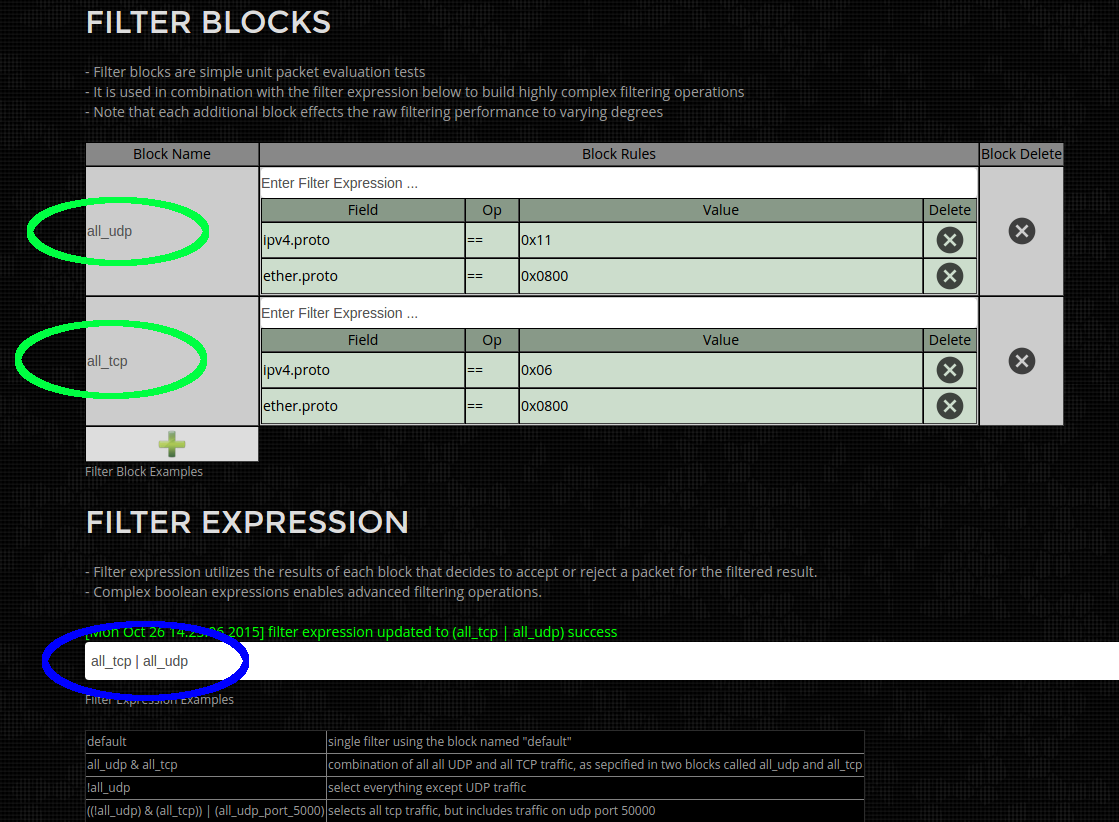
Example Filter (UDP Port 5000 and TCP traffic):
This is a 3 block filter, where the first block "all_udp" (in Green below) selects all UDP packets. The second block "all_tcp" (in green below) selects all TCP packets. And the 3rd block "all_udp_port_5000" selects UDP packets on port 5000.
The Filter expression (in blue below) is some what verbose, as it selects TCP packets (but not UDP) "((!all_udp) & (all_tcp))", technically just all_tcp is sufficient but is expanded for demonstration purposes. OR all UDP packets on port 5000 "all_udp_port_5000". Net result is all TCP and UDP port 5000 packets are selected.
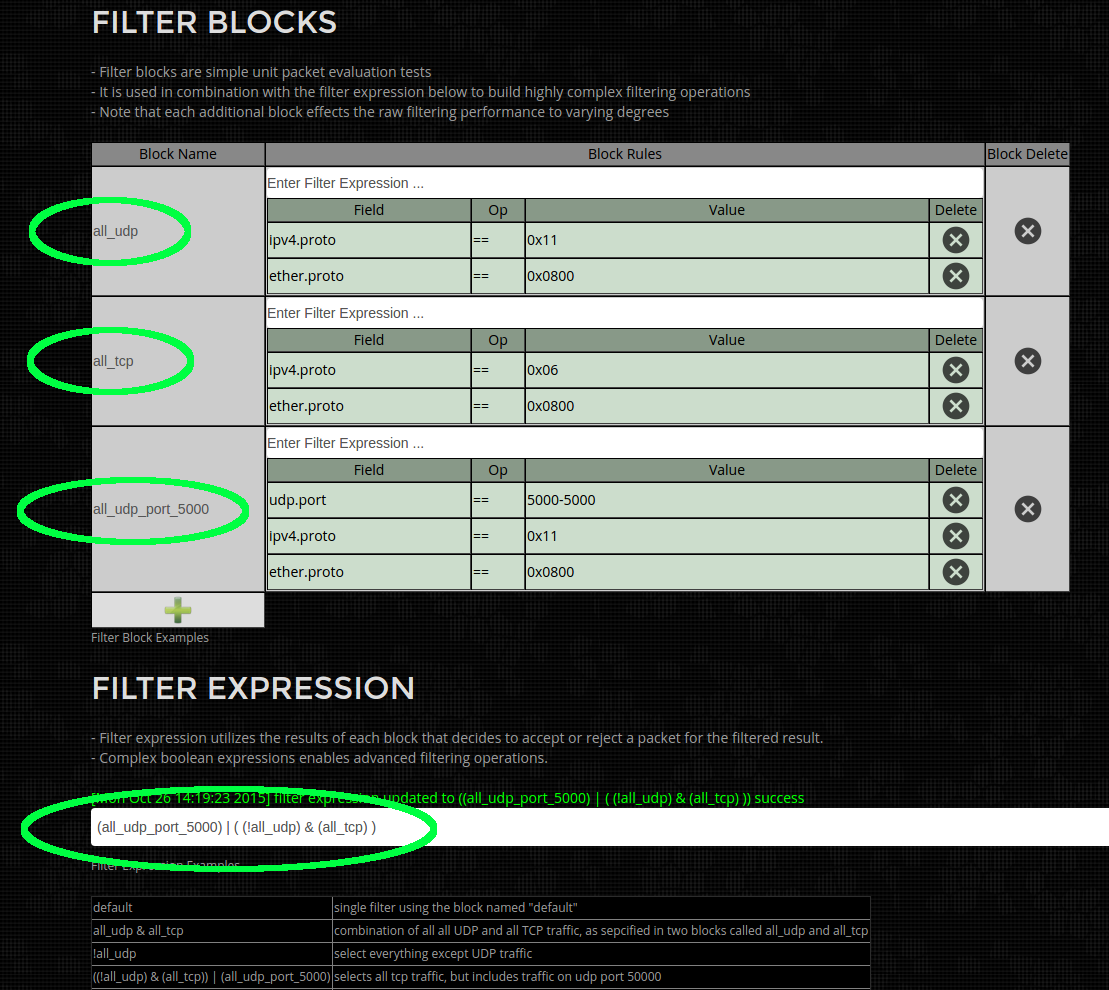
Text based Filters
Entering the same filters via the GUI can sometimes get annoying and is error prone. Thus you can edit and build filter scripts using a configuration file which in many cases is far easier to write and edit.
Configuration File
The Configuration file is located in
/opt/fmadio/etc/packetscope_filter.html
If your has no filter configuration file please download the template from HERE and transfer to the appropriate directory.
The pre-defined filter configuration file looks like this, its a LUA based script file
local FilterList = {}

-- check for all FCS errors
FilterList["FCS Errors"] =
{
    ["Block0"]      = "frame.fcs == fail",

    ["Expression"]  = "Block0",
}

-- simple BPF Host Filter
FilterList["HostCheck 192.168.40.1"] =
{
    ["Block0"]      = "bpf == ip src 192.168.40.1",

    ["Expression"]  = "Block0",
}

-- just for demonstration purposes, how to use multiple blocs
FilterList["tcp data"] =
{
    ["Block0"]      = "bpf == tcp",
    ["Block1"]      = "bpf == vlan and tcp",
    ["Block2"]      = "bpf == mpls and tcp",

    ["Expression"]  = "Block0 | (Block1 | Block2)",
}

return FilterList
This configuration file results in the following Filter Load list show below
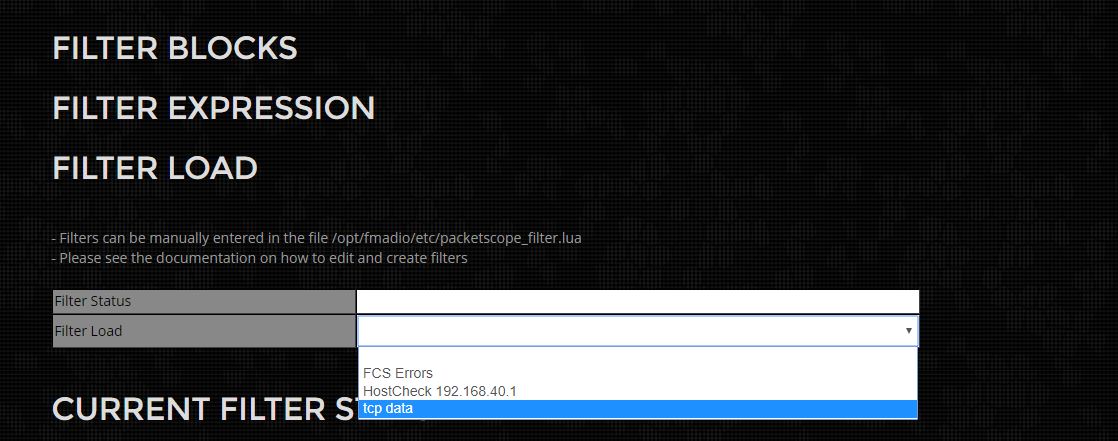
After selecting the filter "tcp data" the following capture Blocks and Expressions are loaded (shown below). As you can see
the Blocks and Expression matches the configuration file.
-- just for demonstration purposes, how to use multiple blocs
FilterList["tcp data"] =
{
    ["Block0"]      = "bpf == tcp",
    ["Block1"]      = "bpf == vlan and tcp",
    ["Block2"]      = "bpf == mpls and tcp",

    ["Expression"]  = "Block0 | (Block1 | Block2)",
}
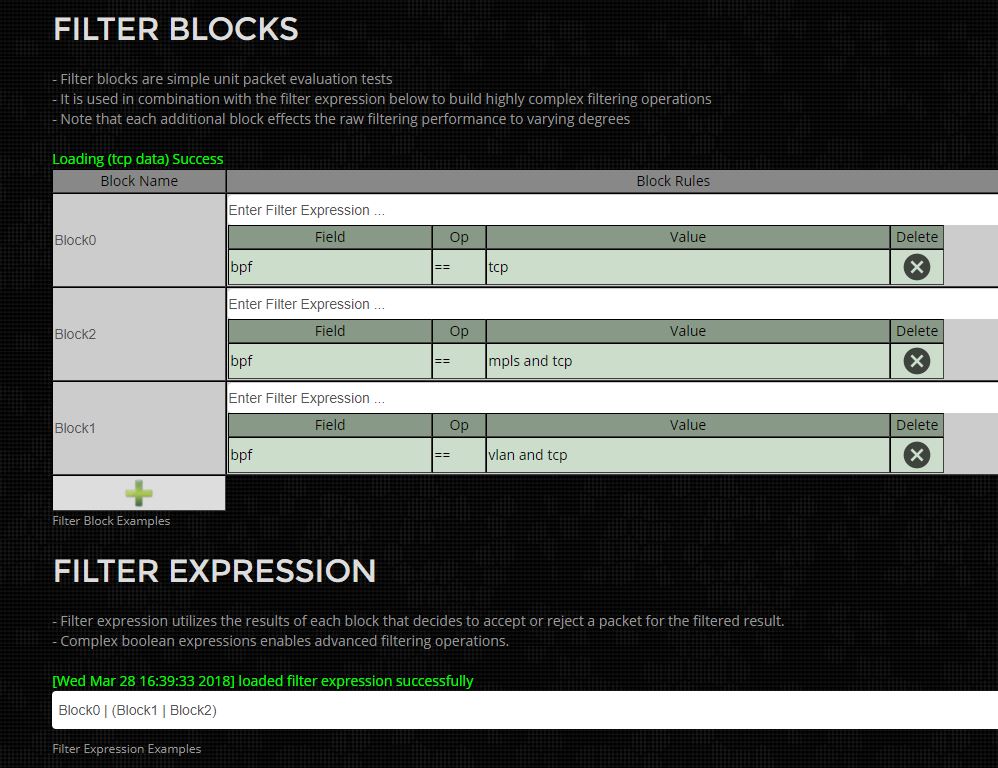
Use a text editor to modify the filter configuration file list to add new filters, then refresh the browser to reload.
Container Setup
FMADIO 10G 40G 100G Packet capture and Replay devices support native Linux Container technology. This enables a very wide range of different application usage models beyond simple packet capture.
Examples are:
- Network Monitoring with Elastic Stack
- Network Intrusion Detection (Suricata)
- Custom build proprietary analysis software
- Financial Markets decode, analysis and monitoring
- ... or just run Wirshark locally on the system!
There are many different usage models, they all require the same initial setup and configuration. The following walks thought the process of an initial container setup.
NOTE: Containers requires a core firmware version from 2019 November+ If your on an older version, please update the Core FW before continuing.
Step 1)
Download the latest base configuration tar ball from here:
Container Release List
Step 2)
Copy and unpack the container base to
/mnt/store0/

fmadio@fmadio20v2-149:/mnt/store0$ tar xfzv 20191012_lxc_base.tar.gz
lxc/
lxc/lock/
lxc/lock/subsys/
lxc/lock/subsys/lxc-ubuntubionic
lxc/lock/subsys/lxc-ubuntubions
lxc/log/
lxc/log/lxc/
.
.
.
.
fmadio@fmadio20v2-149:/mnt/store0$
Step 3)
Install a specific container into the directory /mnt/store0/lxc/lib/lxc/ Installing a container is simply unpacking a tarball and editing any configuration files required.
fmadio@fmadio20v2-149:/mnt/store0/lxc/lib/lxc$ ls -altr
total 12
drwxr-xr-x    3 root     root          4096 Oct 12 21:50 ../
drwxr-xr-x    3 root     root          4096 Oct 12 22:13 ./
drwxrwx---    3 root     root          4096 Oct 12 22:14 ubuntu1/
Elastic Stack Container
Elastic stack is a highly versatile distributed search engine built on top of Apache Lucene. FMADIO has a number of system integrations to process and upload data into a local or remote ES cluster.
The projects are:
- pcap2json: Converts PCAP into Network flows
https://github.com/fmadio/pcap2json
- pcap_bpfcounter: Counts Packets per BPF filter
https://github.com/fmadio/pcap_bpfcounter
To install the ELK container setup as follows
Step 1)
Download the latest ELK container from HERE
Step 2)
Copy and unpack the tarball in the directory
/mnt/store0/lxc/lib/lxc/
Example:
fmadio@fmadio20v2-149:/mnt/store0/lxc/lib/lxc$ sudo tar xfzv 20191012_lxc_ubuntu_es7x.tar.gz
ubuntu_es7x/
ubuntu_es7x/config
ubuntu_es7x/rootfs/
ubuntu_es7x/rootfs/srv/
ubuntu_es7x/rootfs/lib64/
ubuntu_es7x/rootfs/lib64/ld-linux-x86-64.so.2
ubuntu_es7x/rootfs/sys/
ubuntu_es7x/rootfs/proc/
ubuntu_es7x/rootfs/root/
ubuntu_es7x/rootfs/root/.ssh/
.
.
.
.
fmadio@fmadio20v2-149:/mnt/store0/lxc/lib/lxc$
Step 3)
Modify the LXC network configuration setup. Update the static IP address as required, in the below example it is set to 192.168.1.2 on a /24 network.
fmadio@fmadio20v2-149:/mnt/store0/lxc/lib/lxc$ sudo cat ubuntu_es7x/config

# Common configuration
lxc.include = /usr/share/lxc/config/ubuntu.common.conf

# Container specific configuration
lxc.rootfs.path = dir:/opt/fmadio/lxc/lib/lxc/ubuntu_es7x/rootfs
lxc.uts.name = ubuntu_es7x
lxc.arch = amd64

# Network configuration
lxc.net.0.type = veth
lxc.net.0.link = man0
lxc.net.0.flags = up
lxc.net.0.ipv4.address = 192.168.1.2/24

fmadio@fmadio20v2-149:/mnt/store0/lxc/lib/lxc$
Step 3)
Edit the Ubuntu network configuration file, this sets the same static IP address 192.168.1.2 with a GW and DNS at 192.168.1.1
root@fmadio20v2-149:/mnt/store0/lxc/lib/lxc# cat ubuntu_es7x/rootfs/etc/netplan/10-lxc.yaml
network:
  ethernets:
    eth0:
        dhcp4: no
        addresses: [192.168.1.2/24]
        gateway4: 192.168.1.1
        nameservers:
                addresses: [192.168.1.1]
  version: 2
root@fmadio20v2-149:/mnt/store0/lxc/lib/lxc#
Step 4)
Start the container with lxc-start
fmadio@fmadio20v2-149:/mnt/store0/lxc/lib/lxc$ sudo lxc-start -n ubuntu_es7x
fmadio@fmadio20v2-149:/mnt/store0/lxc/lib/lxc$
Step 5)
Attach to the console with the lxc-attach command and check the static IP is correctly setup
fmadio@fmadio20v2-149:/mnt/store0/lxc/lib/lxc$ sudo lxc-attach -n ubuntu_es7x
root@ubuntu1:/# ifconfig
eth0: flags=4163
Then check ES and Kibana are up and ports are open
root@ubuntu1:/# netstat -antl
Active Internet connections (servers and established)
Proto Recv-Q Send-Q Local Address           Foreign Address         State
.
.
tcp        0      0 0.0.0.0:5601            0.0.0.0:*               LISTEN
.
.
tcp        0      0 0.0.0.0:22              0.0.0.0:*               LISTEN
..
tcp6       0      0 :::9200                 :::*                    LISTEN
tcp6       0      0 :::9300                 :::*                    LISTEN
tcp6       0      0 :::22                   :::*                    LISTEN
.
.
tcp6       0      0 127.0.0.1:9200          127.0.0.1:37644         ESTABLISHED
tcp6       0      0 127.0.0.1:9200          127.0.0.1:37634         ESTABLISHED
tcp6       0      0 127.0.0.1:9200          127.0.0.1:37648         ESTABLISHED
tcp6       0      0 127.0.0.1:9200          127.0.0.1:37636         ESTABLISHED
tcp6       0      0 127.0.0.1:9200          127.0.0.1:37650         ESTABLISHED
tcp6       0      0 127.0.0.1:9200          127.0.0.1:37640         ESTABLISHED
tcp6       0      0 127.0.0.1:9200          127.0.0.1:37638         ESTABLISHED
root@ubuntu1:/# exit
exit
fmadio@fmadio20v2-149:/mnt/store0/lxc/lib/lxc$
Step 6)
Connect your browser to http://192.168.1.2:5601 to get Kibana
PCAP2JSON Setup
pcap2json combined with Elastic Stack and Grafana is a very powerful setup for generalized Network Monitoring. A high level architecture of the system looks as follows.
Example Network Configuration:
In the example below the following setup is used:
QSFP28 100G Capture Port A:
Connected to a SPAN or Layer1 TAP usually from a core network switch. Supported modes are 100G SR4 LR4 and LR4/KFEC.
QSFP28 100G Capture Port B:
Connected to a SPAN or Layer1 TAP usually from a core network switch. Supported modes are 100G SR4 LR4 and LR4/KFEC.
QSFP Management Port A
The QSFP 40G management port can be run in 2x40G mode or 4x10G mode.
High speed Management Port A is connected to the Switch with the ES instances. This can be done with a single 40G link, or 2 x 10G Bonded links.
A PTPv2 master clock should be available on one of these links.
QSFP Management Port B
High speed Management Port B connected to the switch attached to the Storage Nodes. For high sustained bandwidth connections its recommended to use a 40G link to maximize magnetic storage node bandwidth. The link is separated from the ES Switch to segment the traffic, as traffic pattern between the ES Push uploads and Storage iSCSI targets are quite different.
1G Management Port
The 1G Management Port connected to the general core network switch. This may be optional as QSFP Management Port A/B may also be connected to the core network.
1G IPMI Port
Usually there is a dedicated Out Of Band management switch. The IPMI/BMC interface is connected to this the dedicated OOB switch. This provides Power On/Off/Reset and KVM access to the system. Full KVM is provided using HTML5 Web GUI
Switchs
While the diagram above has 4 separate switches, in practice these are usually 1 or 2 physical switches. The separation is only shown for diagrammatic purposes.
100Gv2 Analytics Hardware Ports
Picture below shows the physical layout of the network ports on FMADIO 100Gv2 Analytics Packet Capture System.
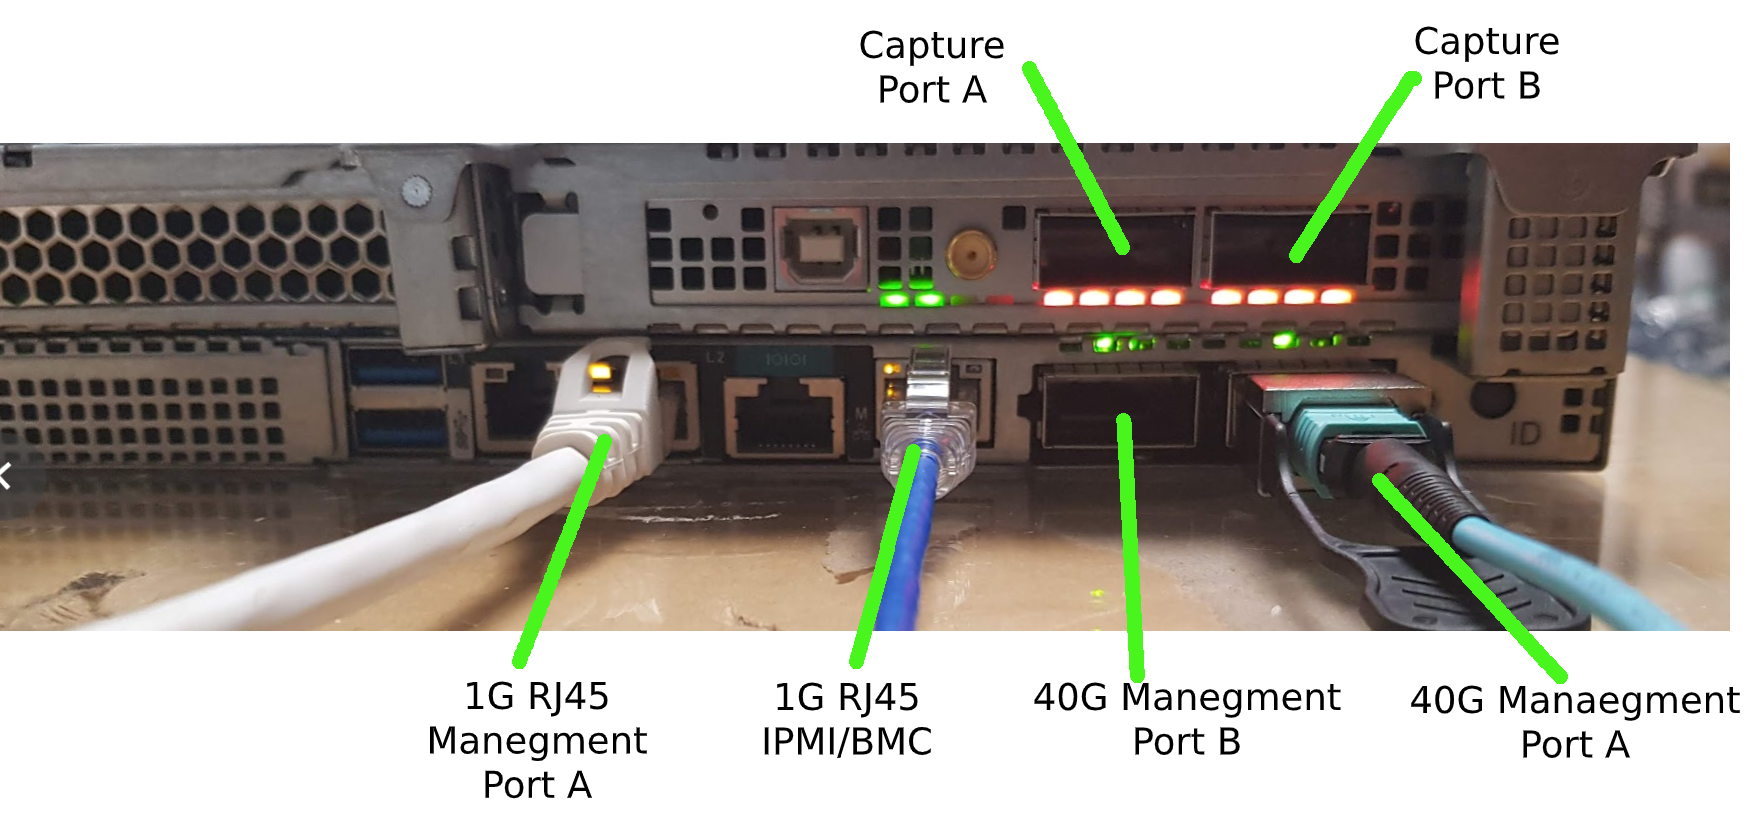
System Log Generation
The first step for any problem resolution is generating detailed log files for analysis to understand the exact nature of the problem. Our system automatically generates logfile information using the following steps.
Step 1)
Select the Tools menu hilighted in green below.
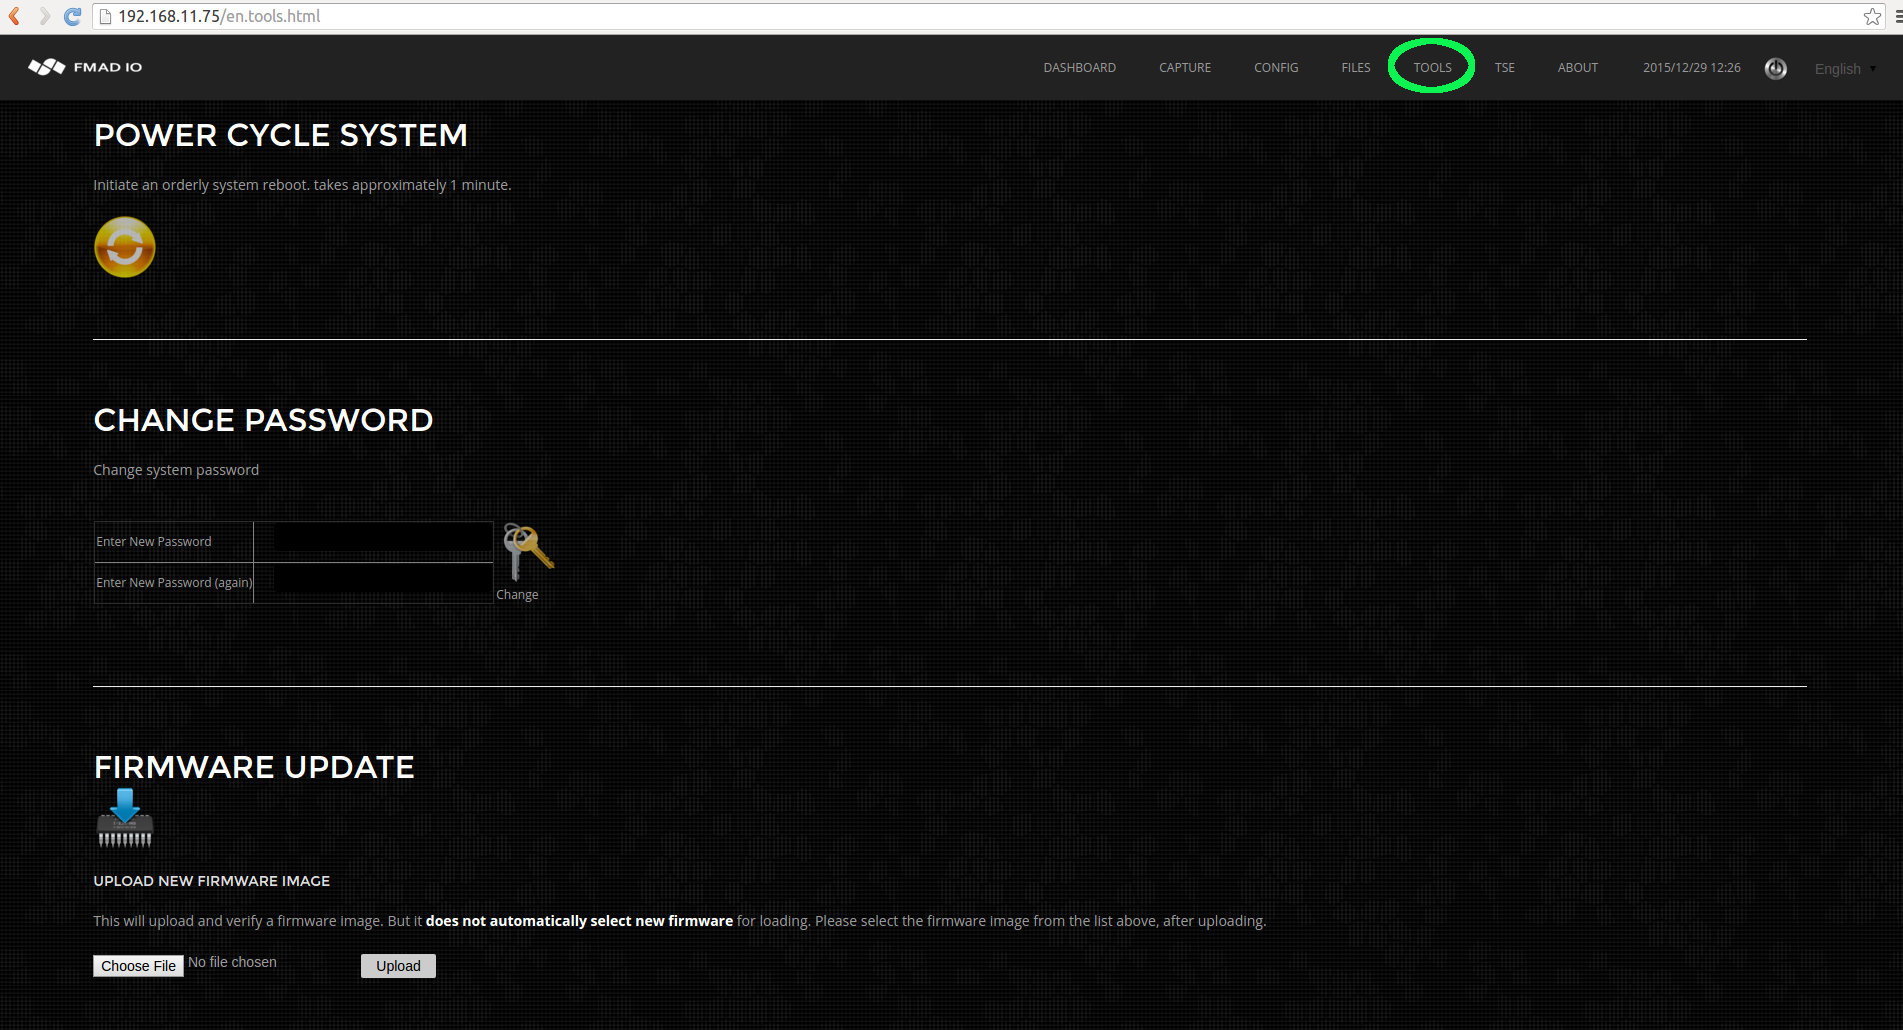
Step 2)
Start System Log generation, by clicking on the icon hilighted in green below.
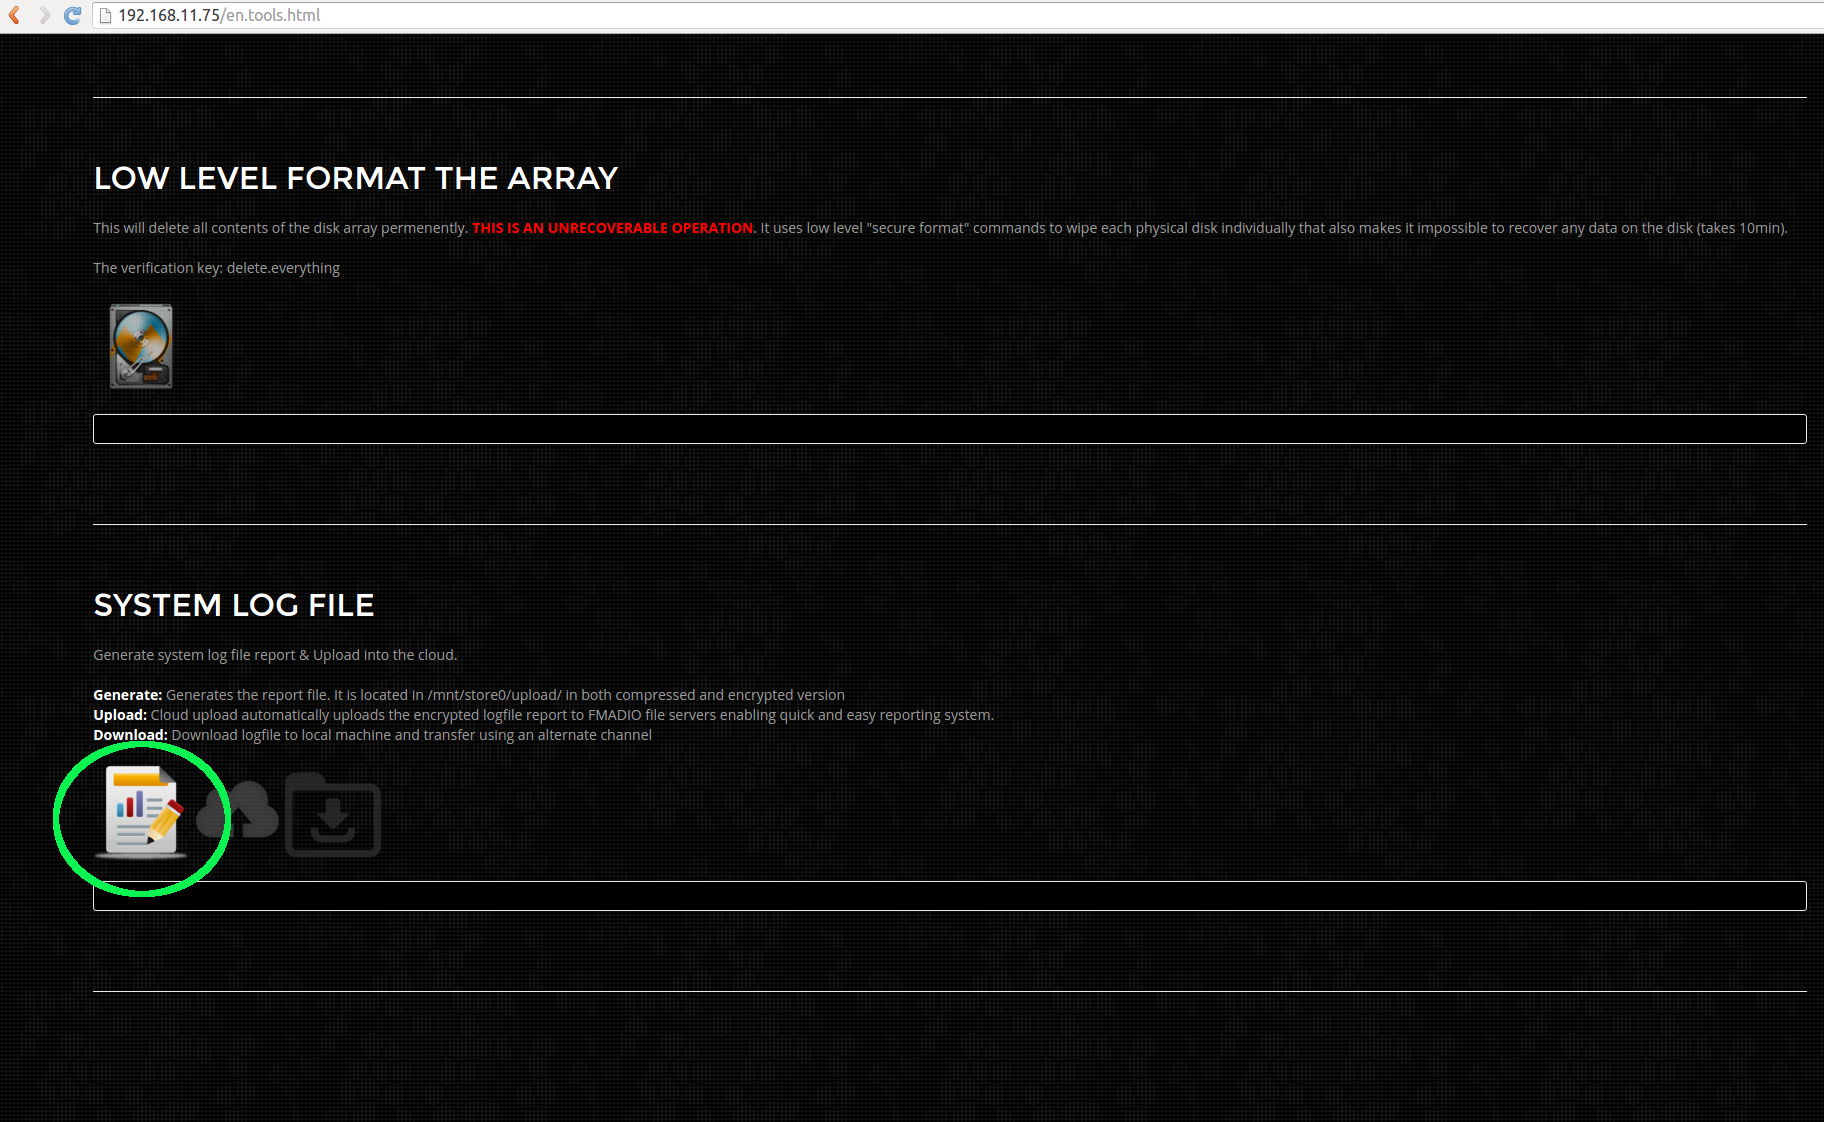
Step 3)
Logfile generation starts with status information shown in area hilighted in green. Depending on the size of logfile this may take from 1 - 15 minutes to complete.
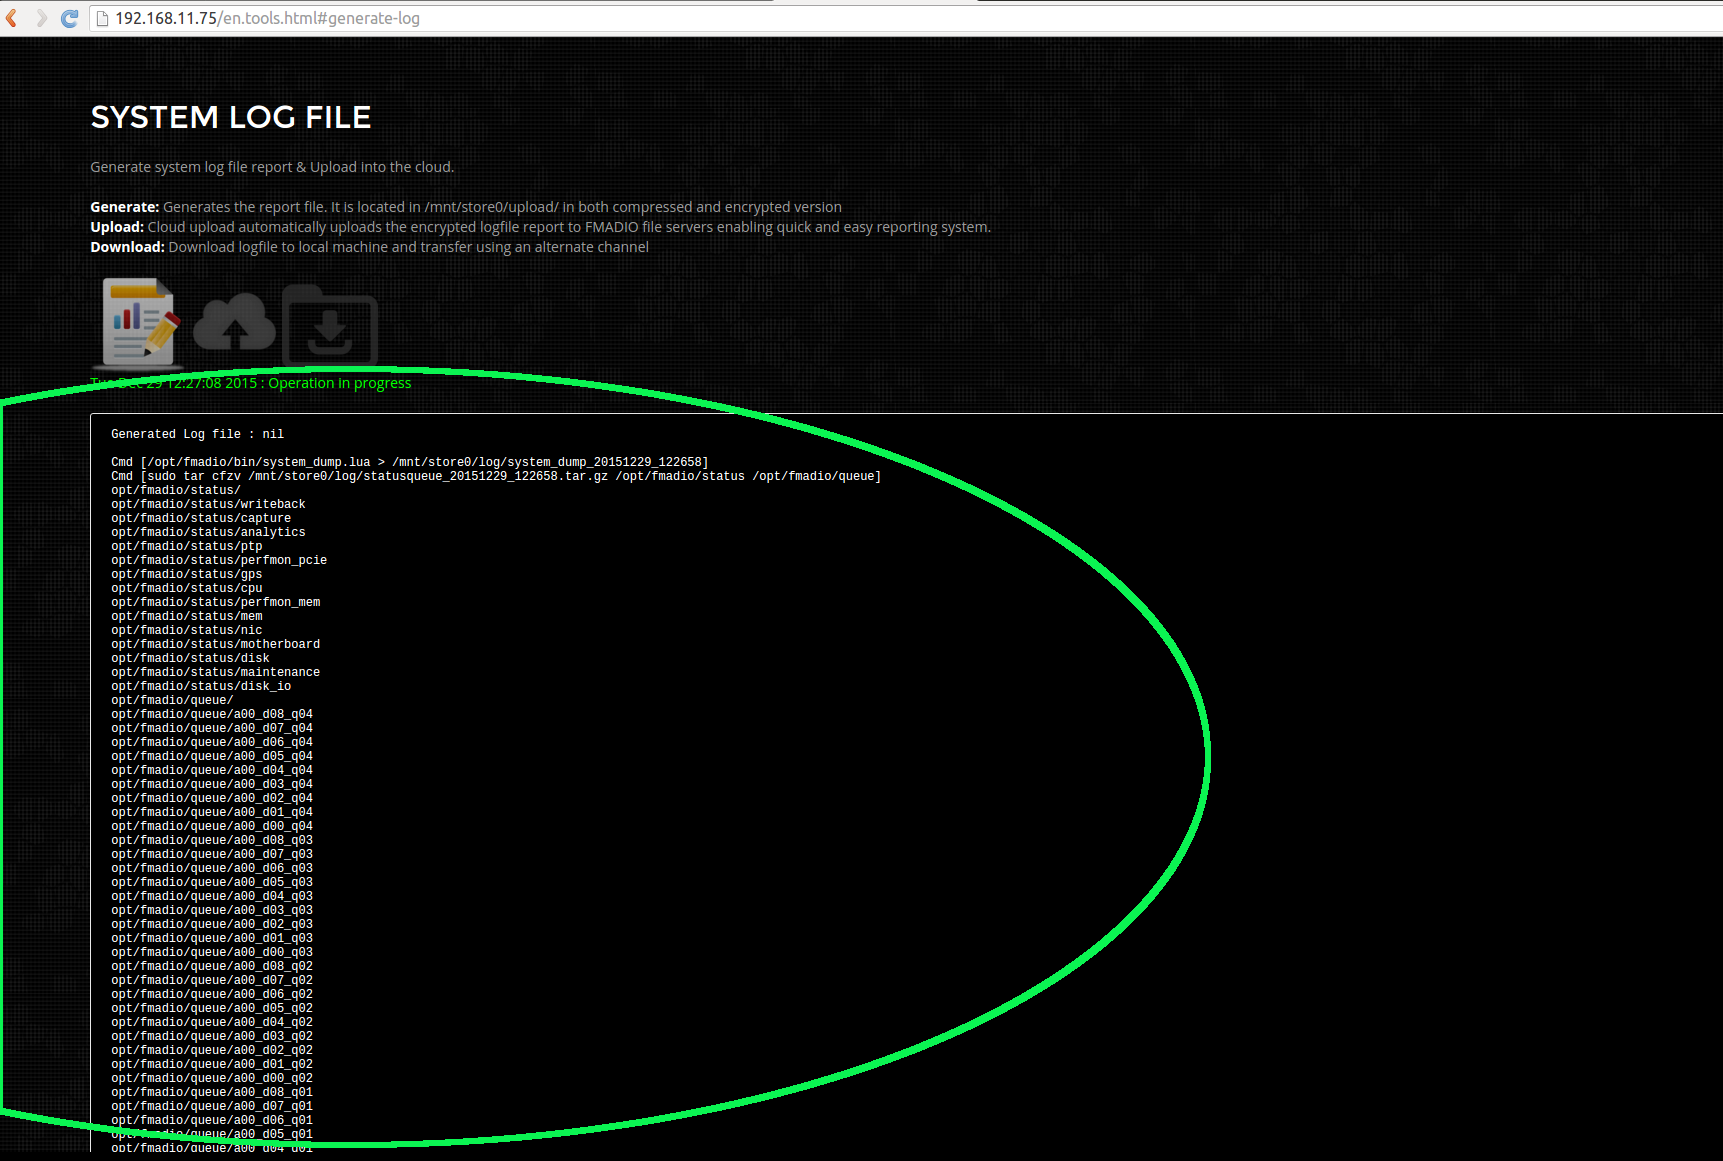
Step 4)
When completed the status will change as hilighted in green below.
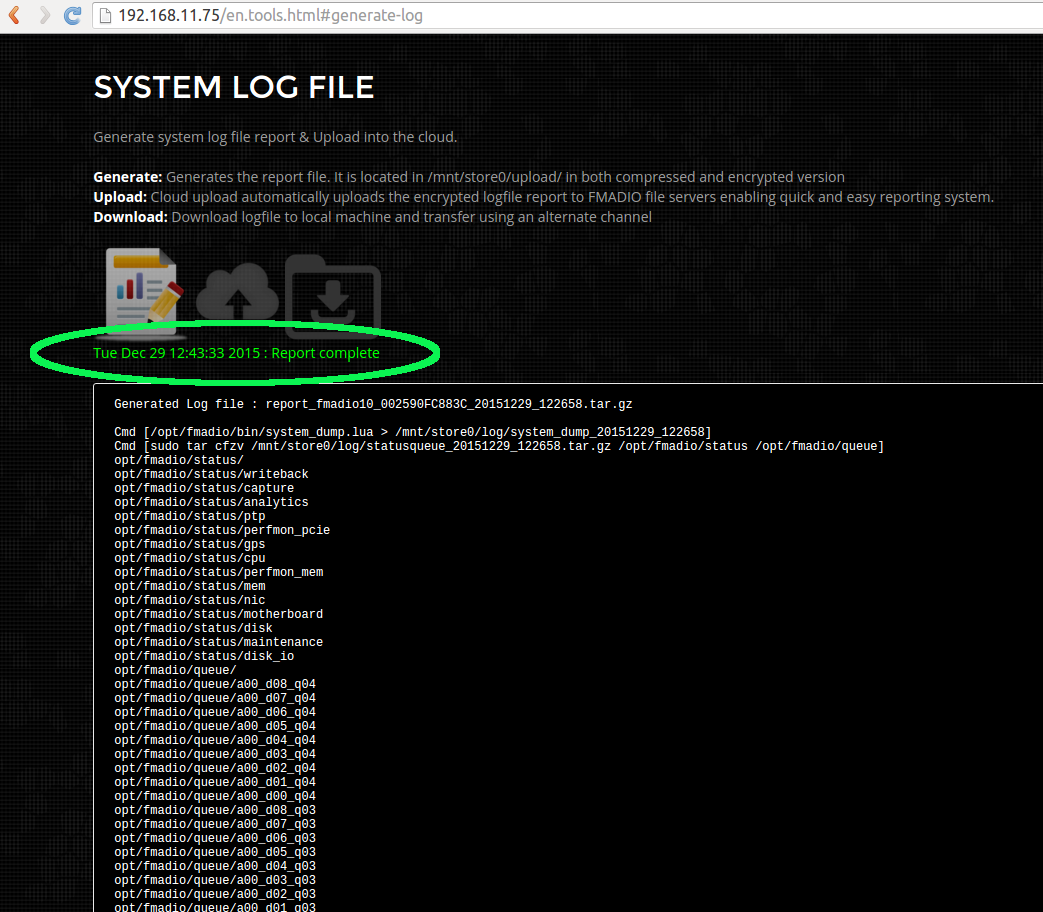
Step 5)
You can now download the report via the icon hilighted in Green. An example downloaded log file is shown in blue below. After download, transfer to us for further analysis.
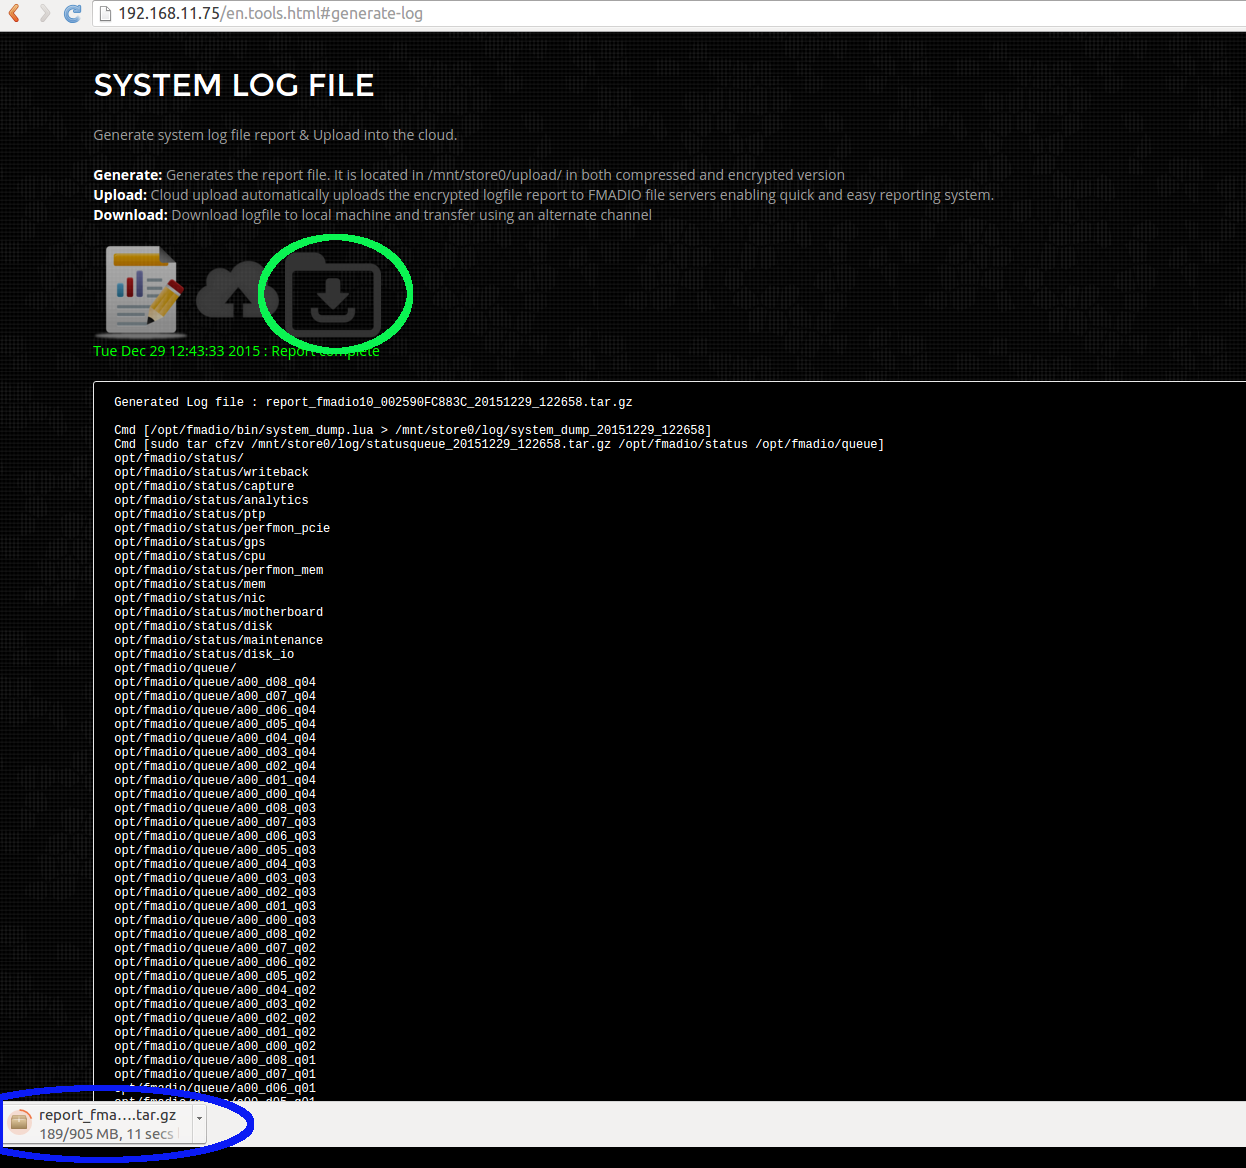
Backup a)
If for some reason the Web GUI has failed the log files are located in this directory
fmadio@fmadio20-049:/mnt/store0/upload$ ls -al
total 2874860
drwxr-xr-x    2 root     root         36864 Dec 29 12:43 ./
drwxr-xr-x  169 fmadio   staff        12288 Dec 29 12:27 ../
-rw-r--r--    1 root     root        145024 Dec 29 12:27 filelist
lrwxrwxrwx    1 root     root            70 Dec 29 12:43 report.tar.gz -> /mnt/store0/upload/report_fmadio10_002590FC883C_20151229_122658.tar.gz
-rw-r--r--    1 root     root     1285506376 Dec 29 12:43 report.tar.gz.asc
-rw-r--r--    1 root     root     949296603 Dec 29 12:43 report_fmadio10_002590FC883C_20151229_122658.tar.gz
The file named filelist is the list of files contained in the logfile. There is a standard tarball and also encrypted tarball. Packet data is included in the log files and please unpack and check the contents complies with your companies security policy.
Backup b)
If logfile generation failed, you can manually invoke system log generation via command line, as shown below
fmadio@fmadio20-049:/mnt/store0/upload$ sudo /opt/fmadio/bin/syslog_report.lua
fmad fmadlua Dec 22 2015
calibrating...
0 : 00000000d09dad48           3.5000 cycles/nsec
Cycles/Sec 3499994440.0000 Std:       0cycle std(  0.00000000)
loading filename [/opt/fmadio/bin/syslog_report.lua]
Cmd [/opt/fmadio/bin/system_dump.lua > /mnt/store0/log/system_dump_20151229_132103]
loading filename [/opt/fmadio/bin/system_dump.lua]
[       iosched_direct.stdouterr_20151229]      1283855            1 MB
[            iosched_direct_20151229_1205]      1365723            2 MB
[               monitor_gps_20151229_1205]      9834318           12 MB
[            monitor_memory_20151229_1205]       809724           13 MB
[               monitor_nic_20151229_1205]      1179945           14 MB
[      statusqueue_20151229_132103.tar.gz]        40916           14 MB
[       stream_capture_sf20_20151229_1205]       288414           14 MB
[               monitor_cpu_20151229_1205]       642415           15 MB
[                 scheduler_20151229_1205]       404614           15 MB
[                             sfptp_stats]      3276884           19 MB
[     stream_writeback.stdouterr_20151229]       973105           20 MB
[          stream_writeback_20151229_1205]      1054488           21 MB
[             system_dump_20151229_132103]      1089180           22 MB
[      monitor_ptp.lua.stdouterr_20151229]        22197           22 MB
[               monitor_ptp_20151229_1205]       676222           23 MB
[        analytics.lua.stdouterr_20151229]        30954           23 MB
.
.
.
.
.
.
The resulting tarball logfile is located in /mnt/store0/upload/report_*.tar.gz Please scp off the device and send.
IPMI Port Access
The Intelligent Platform Management Interface (IPMI) is designed as an out-of-band communication channel, used when normal connectivity with the server has been compromised. If your unable to connect with the system using SSH or HTTP(s) this out-of-band management interface can log into the FMADIO system via the serial port over ethernet.
From the rear port view of the FMADIO10/20 packet capture system, there is are dedicated RJ45 sockets for the IPMI interface highlighted in green. These are connected to your out-of-band management infrastructure, ideally on completely separate subnets and switch`s.
FMADIO10

FMADIO20

The interfaces support ICMP ping, HTTP and SSH protocols IP Address can be configured via the system BIOS or preferable using the FMADIO web interface as highlighted in green below. In this example IPMI port has a static IPv4 Address of 192.168.11.83 on the 192.168.11.0/24 subnet.
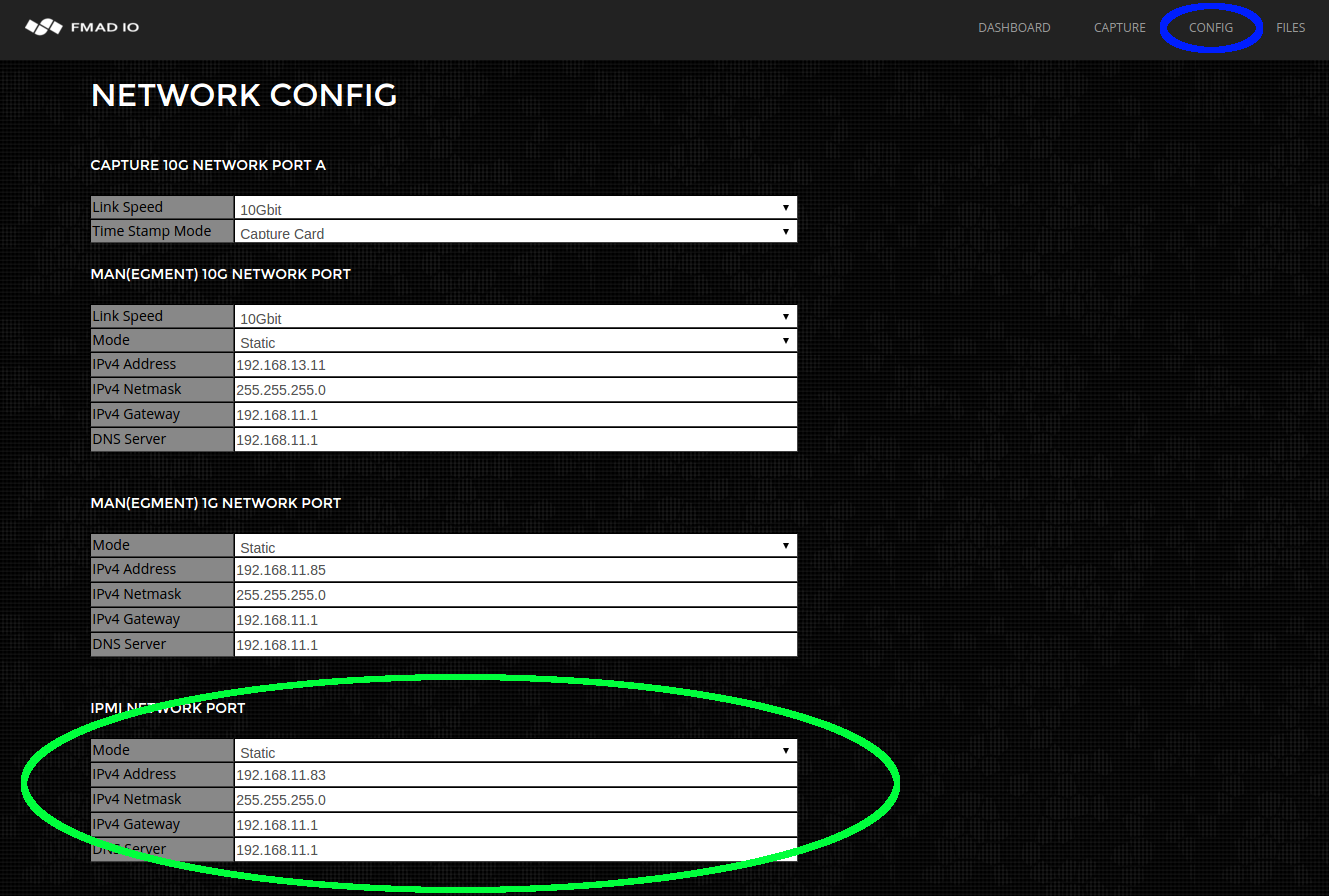
Serial Port Login
Serial port B on the system is connected to the IPMI interface. This allows us to login into the system on the Serial port and is very helpful if the regular network is down for some reason. The procedure is as follows:
16:15:47$ ssh ADMIN@192.168.11.83
ADMIN@192.168.11.83's password:
ATEN SMASH-CLP System Management Shell, version 1.05
Copyright (c) 2008-2009 by ATEN International CO., Ltd.
All Rights Reserved
-> cd system1
/system1
-> cd sol1
/system1/sol1
-> start
/system1/sol1
press
And you now have full access to the system, even when the regular network is down.
Power Cycle
Power cycling / Power Reset the system can be done using the IPMI interface as shown below.
$ ssh ADMIN@192.168.11.83
ADMIN@192.168.11.83's password:

ATEN SMASH-CLP System Management Shell, version 1.05
Copyright (c) 2008-2009 by ATEN International CO., Ltd.
All Rights Reserved

-> cd system1
/system1

-> cd pwrmgtsvc1
/system1/pwrmgtsvc1

-> reset
/system1/pwrmgtsvc1
reset done...
The system will then power down and reboot, it may take a 1 minute for regular SSH and HTTP access to be restored.
Power Off
To power off the system follow the following commands:
$ ssh ADMIN@192.168.11.83
ADMIN@192.168.11.83's password:

ATEN SMASH-CLP System Management Shell, version 1.05
Copyright (c) 2008-2009 by ATEN International CO., Ltd.
All Rights Reserved

-> cd system1
/system1

-> cd pwrmgtsvc1
/system1/pwrmgtsvc1

-> stop
/system1/pwrmgtsvc1
stop done...
The system will then power down completely.
Power On
To power On the system follow the following commands:
$ ssh ADMIN@192.168.11.83
ADMIN@192.168.11.83's password:

ATEN SMASH-CLP System Management Shell, version 1.05
Copyright (c) 2008-2009 by ATEN International CO., Ltd.
All Rights Reserved

-> cd system1
/system1

-> cd pwrmgtsvc1
/system1/pwrmgtsvc1

-> start
/system1/pwrmgtsvc1
start done...
The system will then power up.
API Summary
The FMADIO API is simple and designed for easy scripting integration.
Operating the device
| Description | URL | Example |
Device Operation |
||
| Start Capture on the device |
http://1.1.1.1/sysmaster/capture_start?StreamName=<capture name>
|
Example |
| Stop the current Capture |
http://1.1.1.1/sysmaster/capture_stop
|
Example |
| Get current Capture Status |
http://1.1.1.1/sysmaster/status
|
Example |
Downloading PCAP from the device |
||
| List all captures on the device |
http://1.1.1.1/stream/list
|
Example |
| Split a capture by file size |
http://1.1.1.1/stream/ssize?StreamName=<capture sname>&StreamView=<split mode>
|
Example |
| Split a capture by time |
http://1.1.1.1/stream/stime?StreamName=<capture sname>&StreamView=<split mode>
|
Example |
| Download full capture as single PCAP |
http://1.1.1.1/pcap/single?StreamName=<capture name>
|
Example |
| Download capture as single PCAP with gz compression |
http://1.1.1.1/pcap/single?StreamName=<capture name>?Compression=fast
|
Example |
| Download capture within a specific time |
http://1.1.1.1/pcap/splittime?StreamName=<capture name> |
Example |
| Download capture with BPF Filter |
http://1.1.1.1/pcap/single?StreamName=<capture name> |
Example |
| Download capture with BPF Filter and time range |
http://1.1.1.1/pcap/splittime?StreamName=<capture name> |
Example |
| Download capture with RegEx DPI Filter |
http://1.1.1.1/pcap/splittime?StreamName=<capture name> |
Example |
| Download capture based on Capture Port number |
http://1.1.1.1/pcap/splittime?StreamName=<capture name> |
Example |
Device Management |
||
| Get system status information |
http://1.1.1.1/sysmaster/stats_summary
|
Example |
Start Capture on the Device
This Command starts a capture running on the device
http://1.1.1.1/sysmaster/capture_start?StreamName=<capture name>
$ curl -u fmadio:100g http://192.168.2.75/sysmaster/capture_start?StreamName=TestCapture
{"Status":true,"Str":"[Mon Jul 2 11:18:04 2018] successfully started capture [TestCapture]"}
$
Stop Capture on the Device
Stops any currently capturing process.
NOTE: this does NOT stop scheduled captures.
http://1.1.1.1/sysmaster/capture_stop
$ curl -u fmadio:100g http://192.168.2.75/sysmaster/capture_stop
{"Status":true,"Str":"[Mon Jul 2 11:26:13 2018] successfully stopped capture [TestCapture]"}
$
Capture Status
Returns Capture status of currently active capture
http://1.1.1.1/sysmaster/status
$ curl -u fmadio:100g http://192.168.2.75/sysmaster/status
uptime, 0D 1H 57M
packets_received, 222652795259
packets_dropped, 0
packets_errors, 300000
packets_captured, 222265863667
bytes_captured, 20084978997482
bytes_pending, 0
bytes_disk, 21817945751552
bytes_overflow, 230924484608
bytes_overflow_now, 0
capture0_link, up
capture0_link_uptime, 0D 1H 57M
capture0_link_speed, 10000
capture1_link, up
capture1_link_uptime, 0D 1H 57M
capture1_link_speed, 10000
capture_bytes, 0
capture_packets, 0
capture_bps, 0
capture_pps, 0
capture_name, TestCapture
capture_active, true
Capture List
Lists all captures on the device
http://1.1.1.1/stream/list
$ curl -u fmadio:100g http://192.168.2.75/stream/list
{"Path":"/capture/","StreamList":true,"List":[
{"id":"1","Path":"TestCapture_20180702_1127","PCAP":"/pcap/single?StreamName=TestCapture_20180702_1127&","Filter":"/en.filter.html?StreamName=TestCapture_20180702_1127&","Analytics":"/en.analytics.html?StreamName=TestCapture_20180702_1127&","TCPScope":"/en.tcpscope.html?StreamName=TestCapture_20180702_1127&","Link":"/en.files.html?Fn=view&StreamName=TestCapture_20180702_1127&","Date":1.5304988337881e+18,"Size":168169046016,"Del":"/pcap/del?StreamName=TestCapture_20180702_1127&rand=1530498848939065088&","IsActive":false,"Type":"","Desc":"Mon . 11:33:53 . 02-07-2018"},
{"id":"2","Path":"TestCapture_20180702_1118","PCAP":"/pcap/single?StreamName=TestCapture_20180702_1118&","Filter":"/en.filter.html?StreamName=TestCapture_20180702_1118&","Analytics":"/en.analytics.html?StreamName=TestCapture_20180702_1118&","TCPScope":"/en.tcpscope.html?StreamName=TestCapture_20180702_1118&","Link":"/en.files.html?Fn=view&StreamName=TestCapture_20180702_1118&","Date":1.5304978842841e+18,"Size":0,"Del":"/pcap/del?StreamName=TestCapture_20180702_1118&rand=1530498848939096064&","IsActive":false,"Type":"","Desc":"Mon . 11:18:04 . 02-07-2018"}
]}
$
Capture Split By file size
Lists splits for a specific capture based on file size. Usually this is a 2 step process of
1) get the split list
2) download a specific split
Split options are:
Split_1MB
Split_10MB
Split_100MB
Split_250MB
Split_1GB
Split_2GB
Split_5GB
Split_10GB
Split_100GB
Split_1TB
The below example is using 1GB splits
http://1.1.1.1/stream/stime?StreamName=<capture sname>&StreamView=<split mode>
$ curl -u fmadio:100g "http://192.168.2.75/stream/ssize?StreamName=TestCapture_20180702_1127&StreamView=split_1GB&"
{"Path":"/capture/TestCapture_20180702_1127/split_1GB","SplitFile":true,"List":[
{"id":"0","Path":"20180702_11:32:37.575.806.976","PCAP":"/pcap/splittime?StreamName=TestCapture_20180702_1127&Start=1530498757575806976ULL&Stop=1530498763732682511ULL&&","Filter":"/en.filter.html?StreamName=TestCapture_20180702_1127&StartTS=1530498757575806976&StopTS=1530498763732682511&","Date":1.5304987575758e+18,"Size":1000079360,"PacketCnt":11905708,"ValidPct":100,"Type":"","Desc":"Mon . 11:32:37 . 02-07-2018"},
{"id":"1","Path":"20180702_11:32:43.732.682.511","PCAP":"/pcap/splittime?StreamName=TestCapture_20180702_1127&Start=1530498763732682511ULL&Stop=1530498764151788331ULL&&","Filter":"/en.filter.html?StreamName=TestCapture_20180702_1127&StartTS=1530498763732682511&StopTS=1530498764151788331&","Date":1.5304987637327e+18,"Size":1000079360,"PacketCnt":11905707,"ValidPct":100,"Type":"","Desc":"Mon . 11:32:43 . 02-07-2018"},
{"id":"2","Path":"20180702_11:32:44.151.788.331","PCAP":"/pcap/splittime?StreamName=TestCapture_20180702_1127&Start=1530498764151788331ULL&Stop=1530498764570894137ULL&&","Filter":"/en.filter.html?StreamName=TestCapture_20180702_1127&StartTS=1530498764151788331&StopTS=1530498764570894137&","Date":1.5304987641518e+18,"Size":1000079360,"PacketCnt":11905706,"ValidPct":100,"Type":"","Desc":"Mon . 11:32:44 . 02-07-2018"},
{"id":"3","Path":"20180702_11:32:44.570.894.137","PCAP":"/pcap/splittime?StreamName=TestCapture_20180702_1127&Start=1530498764570894137ULL&Stop=1530498764989999979ULL&&","Filter":"/en.filter.html?StreamName=TestCapture_20180702_1127&StartTS=1530498764570894137&StopTS=1530498764989999979&","Date":1.5304987645709e+18,"Size":1000079360,"PacketCnt":11905707,"ValidPct":100,"Type":"","Desc":"Mon . 11:32:44 . 02-07-2018"},
{"id":"4","Path":"20180702_11:32:44.989.999.979","PCAP":"/pcap/splittime?StreamName=TestCapture_20180702_1127&Start=1530498764989999979ULL&Stop=1530498765409105800ULL&&","Filter":"/en.filter.html?StreamName=TestCapture_20180702_1127&StartTS=1530498764989999979&StopTS=1530498765409105800&","Date":1.53049876499e+18,"Size":1000079360,"PacketCnt":11905707,"ValidPct":100,"Type":"","Desc":"Mon . 11:32:44 . 02-07-2018"},
{"id":"5","Path":"20180702_11:32:45.409.105.800","PCAP":"/pcap/splittime?StreamName=TestCapture_20180702_1127&Start=1530498765409105800ULL&Stop=1530498765828211598ULL&&","Filter":"/en.filter.html?StreamName=TestCapture_20180702_1127&StartTS=1530498765409105800&StopTS=1530498765828211598&","Date":1.5304987654091e+18,"Size":1000079360,"PacketCnt":11905706,"ValidPct":100,"Type":"","Desc":"Mon . 11:32:45 . 02-07-2018"},
{"id":"6","Path":"20180702_11:32:45.828.211.598","PCAP":"/pcap/splittime?StreamName=TestCapture_20180702_1127&Start=1530498765828211598ULL&Stop=1530498766247317455ULL&&","Filter":"/en.filter.html?StreamName=TestCapture_20180702_1127&StartTS=1530498765828211598&StopTS=1530498766247317455&","Date":1.5304987658282e+18,"Size":1000079360,"PacketCnt":11905707,"ValidPct":100,"Type":"","Desc":"Mon . 11:32:45 . 02-07-2018"},
{"id":"7","Path":"20180702_11:32:46.247.317.455","PCAP":"/pcap/splittime?StreamName=TestCapture_20180702_1127&Start=1530498766247317455ULL&Stop=1530498766666423276ULL&&","Filter":"/en.filter.html?StreamName=TestCapture_20180702_1127&StartTS=1530498766247317455&StopTS=1530498766666423276&","Date":1.5304987662473e+18,"Size":1000079360,"PacketCnt":11905707,"ValidPct":100,"Type":"","Desc":"Mon . 11:32:46 . 02-07-2018"},
.
.
.
.
Once you have the split list can select a specific URL from it and download. For example using split #3 from 20180702_11:32:44.570.894.137.
{"id":"3","Path":"20180702_11:32:44.570.894.137","PCAP":"/pcap/splittime?StreamName=TestCapture_20180702_1127&Start=1530498764570894137ULL&Stop=1530498764989999979ULL&&","Filter":"/en.filter.html?StreamName=TestCapture_20180702_1127&StartTS=1530498764570894137&StopTS=1530498764989999979&","Date":1.5304987645709e+18,"Size":1000079360,"PacketCnt":11905707,"ValidPct":100,"Type":"","Desc":"Mon . 11:32:44 . 02-07-2018"},
And then downloading the split and piping to tcpdump for example
$ curl -u fmadio:100g "http://192.168.2.75/pcap/splittime?StreamName=TestCapture_20180702_1127&Start=1530498764570894137ULL&Stop=1530498764989999979ULL&&" | tcpdump -r - -nn | head
11:32:44.570894 66:77:88:99:aa:bb > 00:33:33:33:33:33 Null Information, send seq 10, rcv seq 23, Flags [Command], length 54
0x0000: 0000 142e 0f3c 152e 0f3c 162e 0f3c 172e .....<...<...<..
0x0010: 0f3c 182e 0f3c 192e 0f3c 1a2e 0f3c 1b2e .<...<...<...<..
0x0020: 0f3c 1c2e 0f3c 1d2e 0f3c 1e2e 0f3c 1f2e .<...<...<...<..
0x0030: 0f3c c40d a204 .<....
11:32:44.570894 66:77:88:99:aa:bb > 00:44:44:44:44:44 Null Information, send seq 16, rcv seq 23, Flags [Command], length 54
0x0000: 0000 202e 0f4c 212e 0f4c 222e 0f4c 232e .....L!..L"..L#.
0x0010: 0f4c 242e 0f4c 252e 0f4c 262e 0f4c 272e .L$..L%..L&..L'.
0x0020: 0f4c 282e 0f4c 292e 0f4c 2a2e 0f4c 2b2e .L(..L)..L*..L+.
0x0030: 0f4c 232f 80c5 .L#/..
Capture Split By time
Lists splits for a specific capture based on a time unit. Usually this is a 2 step process of
1) get the split list
2) download a specific split
Split options are:
Split_1sec
Split_10sec
Split_1min
Split_10min
Split_15min
Split_1hour
Split_2hour
Split_4hour
Split_6hour
Split_8hour
Split_12hour
The below example is using 1sec splits
http://1.1.1.1/stream/stime?StreamName=<capture sname>&StreamView=<split mode>
$ curl -u fmadio:100g "http://192.168.2.75/stream/stime?StreamName=TestCapture_20180702_1127&StreamView=split_1sec&"
{"Path":"/capture/TestCapture_20180702_1127/split_1sec","SplitFile":true,"List":[
{"id":"0","Path":"20180702_11:32:37.000.000.000","PCAP":"/pcap/splittime?StreamName=TestCapture_20180702_1127&Start=1530498757000000000ULL&Stop=1530498758000000000ULL&&","Filter":"/en.filter.html?StreamName=TestCapture_20180702_1127&StartTS=1530498757000000000&StopTS=1530498758000000000&","Date":1.530498757e+18,"Size":167772160,"PacketCnt":1997289,"ValidPct":100,"Type":"","Desc":"Mon . 11:32:37 . 02-07-2018"},
{"id":"1","Path":"20180702_11:32:38.000.000.000","PCAP":"/pcap/splittime?StreamName=TestCapture_20180702_1127&Start=1530498758000000000ULL&Stop=1530498759000000000ULL&&","Filter":"/en.filter.html?StreamName=TestCapture_20180702_1127&StartTS=1530498758000000000&StopTS=1530498759000000000&","Date":1.530498758e+18,"Size":0,"PacketCnt":0,"ValidPct":100,"Type":"","Desc":"Mon . 11:32:38 . 02-07-2018"},
{"id":"2","Path":"20180702_11:32:39.000.000.000","PCAP":"/pcap/splittime?StreamName=TestCapture_20180702_1127&Start=1530498759000000000ULL&Stop=1530498760000000000ULL&&","Filter":"/en.filter.html?StreamName=TestCapture_20180702_1127&StartTS=1530498759000000000&StopTS=1530498760000000000&","Date":1.530498759e+18,"Size":0,"PacketCnt":0,"ValidPct":100,"Type":"","Desc":"Mon . 11:32:39 . 02-07-2018"},
{"id":"3","Path":"20180702_11:32:40.000.000.000","PCAP":"/pcap/splittime?StreamName=TestCapture_20180702_1127&Start=1530498760000000000ULL&Stop=1530498761000000000ULL&&","Filter":"/en.filter.html?StreamName=TestCapture_20180702_1127&StartTS=1530498760000000000&StopTS=1530498761000000000&","Date":1.53049876e+18,"Size":0,"PacketCnt":0,"ValidPct":100,"Type":"","Desc":"Mon . 11:32:40 . 02-07-2018"},
{"id":"4","Path":"20180702_11:32:41.000.000.000","PCAP":"/pcap/splittime?StreamName=TestCapture_20180702_1127&Start=1530498761000000000ULL&Stop=1530498762000000000ULL&&","Filter":"/en.filter.html?StreamName=TestCapture_20180702_1127&StartTS=1530498761000000000&StopTS=1530498762000000000&","Date":1.530498761e+18,"Size":0,"PacketCnt":0,"ValidPct":100,"Type":"","Desc":"Mon . 11:32:41 . 02-07-2018"},
{"id":"5","Path":"20180702_11:32:42.000.000.000","PCAP":"/pcap/splittime?StreamName=TestCapture_20180702_1127&Start=1530498762000000000ULL&Stop=1530498763000000000ULL&&","Filter":"/en.filter.html?StreamName=TestCapture_20180702_1127&StartTS=1530498762000000000&StopTS=1530498763000000000&","Date":1.530498762e+18,"Size":0,"PacketCnt":0,"ValidPct":100,"Type":"","Desc":"Mon . 11:32:42 . 02-07-2018"},
See Split by Size example above for more detail
Download Single Capture
Download entire capture as a single file. Exmaple shows downloading and piping via tcpdump. Piping to a file or any other analysis tools is possible.
http://1.1.1.1/pcap/single?StreamName=<capture name>?Compression=fast
$ curl -u fmadio:100g "http://192.168.2.75/pcap/single?StreamName=TestCapture_20180702_1127&" | tcpdump -r - -nn | head
11:32:37.575907 66:77:88:99:aa:bb > 00:44:44:44:44:44 Null Information, send seq 0, rcv seq 0, Flags [Command], length 54
0x0000: 0000 0000 0040 0100 0040 0200 0040 0300 .....@...@...@..
0x0010: 0040 0400 0040 0500 0040 0600 0040 0700 .@...@...@...@..
0x0020: 0040 0800 0040 0900 0040 0a00 0040 0b00 .@...@...@...@..
0x0030: 0040 e59d 3993 .@..9.
11:32:37.575907 66:77:88:99:aa:bb > 00:33:33:33:33:33 Null Information, send seq 0, rcv seq 0, Flags [Command], length 54
0x0000: 0000 0000 0030 0100 0030 0200 0030 0300 .....0...0...0..
0x0010: 0030 0400 0030 0500 0030 0600 0030 0700 .0...0...0...0..
0x0020: 0030 0800 0030 0900 0030 0a00 0030 0b00 .0...0...0...0..
0x0030: 0030 52a4 9d2a .0R..*
.
.
.
.
.
Download Single Capture With Compression
Download entire capture as a single file as above, execpt gip compress it before sending down the wire
http://1.1.1.1/pcap/single?StreamName=<capture name>?Compression=fast
$ curl -u fmadio:100g "http://192.168.2.75/pcap/single?StreamName=TestCapture_20180702_1127&Compression=fast" | gzip -d -c | tcpdump -r - -nn | head
11:32:37.575907 66:77:88:99:aa:bb > 00:44:44:44:44:44 Null Information, send seq 0, rcv seq 0, Flags [Command], length 54
0x0000: 0000 0000 0040 0100 0040 0200 0040 0300 .....@...@...@..
0x0010: 0040 0400 0040 0500 0040 0600 0040 0700 .@...@...@...@..
0x0020: 0040 0800 0040 0900 0040 0a00 0040 0b00 .@...@...@...@..
0x0030: 0040 e59d 3993 .@..9.
11:32:37.575907 66:77:88:99:aa:bb > 00:33:33:33:33:33 Null Information, send seq 0, rcv seq 0, Flags [Command], length 54
0x0000: 0000 0000 0030 0100 0030 0200 0030 0300 .....0...0...0..
0x0010: 0030 0400 0030 0500 0030 0600 0030 0700 .0...0...0...0..
0x0020: 0030 0800 0030 0900 0030 0a00 0030 0b00 .0...0...0...0..
0x0030: 0030 52a4 9d2a .0R..*
.
.
.
.
.
Download Capture with Time Filter
Download the capture with a time filter. Note the nanosecond Epoch Start is 1530498788000000000. Removing the nanosecond part convert epoch to date/time.
$ date -d @1530498788
Mon Jul 2 11:33:08 JST 2018
Which matches the timestamp TCPDUMP shows of 11:33:08.000000.
http://1.1.1.1/pcap/splittime?StreamName=<capture name>
    &Start=<nano second epoch start time>
    &Stop=<nano second epoch stop time>
$ curl -u fmadio:100g "http://192.168.2.75/pcap/splittime?StreamName=TestCapture_20180702_1127&&Start=1530498788000000000&Stop=1530498789000000000&" | tcpdump -r - -nn | head
11:33:08.000000 66:77:88:99:aa:bb > 00:44:44:44:44:44 Null Information, send seq 22, rcv seq 1, Flags [Poll], length 54
0x0000: 0000 2c03 153a 2d03 153a 2e03 153a 2f03 ..,..:-..:...:/.
0x0010: 153a 3003 153a 3103 153a 3203 153a 3303 .:0..:1..:2..:3.
0x0020: 153a 3403 153a 3503 153a 3603 153a 3703 .:4..:5..:6..:7.
0x0030: 153a a878 4e26 .:.xN&
11:33:08.000000 66:77:88:99:aa:bb > 00:33:33:33:33:33 Null Information, send seq 22, rcv seq 1, Flags [Poll], length 54
0x0000: 0000 2c03 152a 2d03 152a 2e03 152a 2f03 ..,..*-..*...*/.
0x0010: 152a 3003 152a 3103 152a 3203 152a 3303 .*0..*1..*2..*3.
0x0020: 152a 3403 152a 3503 152a 3603 152a 3703 .*4..*5..*6..*7.
0x0030: 152a 7b57 491d .*{WI.
.
.
.
.
.
Download Capture with BPF Filter
Download the capture with using a BPF filter expression. Note: the FilterBPF argument must be ESCAPE encoded. Luckly curl has a builtin function to do exactly this via the -G --data-urlencode command line argument. In this example we`re filter for TCP only data
http://1.1.1.1/pcap/single?StreamName=<capture name>
    &FilterBPF=<escape encoded BPF filter>
$ curl -u fmadio:100g "http://192.168.2.75/pcap/single?StreamName=hitcon_20180702_1503_58&" -G --data-urlencode "FilterBPF=tcp" | tcpdump -r - -nn | head
02:00:30.332313 IP 10.5.9.102.51697 > 54.183.128.64.22222: Flags [P.], seq 4050064906:4050064990, ack 2728668122, win 1444, options [nop,nop,TS val 215614 ecr 37355221], length 84
02:00:30.354576 IP 54.183.128.64.22222 > 10.5.9.102.51697: Flags [.], ack 168, win 1451, options [nop,nop,TS val 37355240 ecr 215614], length 0
02:00:30.354824 IP 54.183.128.64.22222 > 10.5.9.102.51697: Flags [P.], seq 1:85, ack 168, win 1452, options [nop,nop,TS val 37355240 ecr 215614], length 84
02:00:30.356871 IP 10.5.9.102.51697 > 54.183.128.64.22222: Flags [P.], seq 168:252, ack 85, win 1444, options [nop,nop,TS val 215620 ecr 37355240], length 84
02:00:30.409538 IP 130.0.41.22.17918 > 10.5.9.102.55190: Flags [.], ack 2140812904, win 63, options [nop,nop,TS val 1482614 ecr 1546733746], length 0
02:00:30.409689 IP 10.5.9.102.55557 > 74.125.224.174.443: Flags [.], ack 1325521504, win 16407, length 0
02:00:30.424368 IP 54.183.128.64.22222 > 10.5.9.102.51697: Flags [.], ack 252, win 1452, options [nop,nop,TS val 37355258 ecr 215620], length 0
02:00:30.461303 IP 54.183.128.64.22222 > 10.5.9.102.51697: Flags [P.], seq 85:169, ack 252, win 1452, options [nop,nop,TS val 37355266 ecr 215620], length 84
02:00:30.463300 IP 10.5.9.102.51697 > 54.183.128.64.22222: Flags [P.], seq 252:336, ack 169, win 1444, options [nop,nop,TS val 215646 ecr 37355266], length 84
02:00:30.485763 IP 54.183.128.64.22222 > 10.5.9.102.51697: Flags [.], ack 336, win 1452, options [nop,nop,TS val 37355273 ecr 215646], length 0
.
.
.
.
.
Download Capture with BPF and Time Filter
Download the capture with using a BPF and time range filter expression. Similar to above, but slightly differnt URL and BPF filter. Epoch time for reference is shown below
$ date -d @1407525720
Sat Aug 9 04:22:00 JST 2014
And the capture data
http://1.1.1.1/pcap/splittime?StreamName=<capture name>
    &FilterBPF=<escape encoded BPF filter>
    &Start=<nano second epoch start time>
    &Stop=<nano second epoch stop time>
$ curl -u fmadio:100g "http://192.168.2.75/pcap/splittime?StreamName=upload_20180702_1503_58&Start=1407525720000000000ULL&Stop=1407525780000000000ULL&&" -G --data-urlencode "FilterBPF=udp" | tcpdump -r - -nn | head
04:22:00.176594 IP 10.5.9.102.64905 > 111.221.77.176.33033: UDP, length 33
04:22:00.470634 IP 10.5.9.102.34853 > 8.8.8.8.53: 45853+ A? trello.com. (28)
04:22:00.470727 IP 10.5.9.102.34853 > 8.8.8.8.53: 19240+ AAAA? trello.com. (28)
04:22:00.470867 IP 10.5.9.102.49156 > 8.8.8.8.53: 10810+ A? trello.com. (28)
04:22:00.770120 IP 10.5.9.102.53156 > 157.56.52.13.33033: UDP, length 36
04:22:00.770316 IP 10.5.9.2.57485 > 10.5.9.1.53: 21292+ A? team9.defcon.legitbs.net. (42)
04:22:00.770325 IP 10.5.9.2.57485 > 10.5.9.1.53: 31759+ AAAA? team9.defcon.legitbs.net. (42)
04:22:00.770568 IP 10.5.9.1.53 > 10.5.9.2.57485: 21292* 1/1/2 A 10.5.9.2 (125)
04:22:00.770581 IP 10.5.9.1.53 > 10.5.9.2.57485: 31759* 0/1/0 (93)
04:22:00.792282 IP 10.5.9.2.54477 > 10.5.9.1.53: 23954+ A? team9.defcon.legitbs.net. (42)
.
.
.
.
.
Download Capture with a RegEx DPI filter
Download the capture with using a RegEx DPI filter. This example checks for the case-insensitve string "login"
http://1.1.1.1/pcap/splittime?StreamName=<capture name>
    &FilterRE=<escape encoded RegEx expression>
$ curl -u fmadio:100g "http://192.168.2.75/pcap/single?StreamName=upload_20180702_1503_58" -G --data-urlencode "FilterRE=/login/i" | tcpdump -r - -nn -XX | head -n 100
02:45:29.102245 IP 10.5.9.102.64023 > 10.5.6.108.81: Flags [P.], seq 1873767145:1873768135, ack 3186613245, win 8235, options [nop,nop,TS val 869215714 ecr 388587], length 990
0x0000: 0010 1872 003c e03f 496a afa1 0800 4500 ...r.<.?Ij....E.
0x0010: 0412 4763 4000 3f06 cca7 0a05 0966 0a05 ..Gc@.?......f..
0x0020: 066c fa17 0051 6faf 6ae9 bdef dbfd 8018 .l...Qo.j.......
0x0030: 202b b13b 0000 0101 080a 33cf 2de2 0005 .+.;......3.-...
0x0040: edeb 4745 5420 2f6c 6f67 696e 2f69 6e64 ..GET./login/ind
0x0050: 6578 2e70 6870 2048 5454 502f 312e 310d ex.php.HTTP/1.1.
0x0060: 0a48 6f73 743a 2031 302e 352e 362e 3130 .Host:.10.5.6.10
0x0070: 383a 3831 0d0a 436f 6f6b 6965 3a20 5f5f 8:81..Cookie:.__
0x0080: 7574 6d61 3d39 3632 3735 3835 302e 3135 utma=96275850.15
0x0090: 3530 3039 3837 3430 2e31 3430 3533 3333 50098740.1405333
0x00a0: 3833 362e 3134 3035 3932 3733 3236 2e31 836.1405927326.1
0x00b0: 3430 3539 3239 3530 382e 333b 205f 5f75 405929508.3;.__u
0x00c0: 746d 7a3d 3936 3237 3538 3530 2e31 3430 tmz=96275850.140
0x00d0: 3539 3239 3530 382e 332e 322e 7574 6d63 5929508.3.2.utmc
0x00e0: 7372 3d67 6f6f 676c 657c 7574 6d63 636e sr=google|utmccn
0x00f0: 3d28 6f72 6761 6e69 6329 7c75 746d 636d =(organic)|utmcm
0x0100: 643d 6f72 6761 6e69 637c 7574 6d63 7472 d=organic|utmctr
.
.
.
.
.
Download Capture With Port filter
Download the capture specifying the port capture number
http://1.1.1.1/pcap/splittime?StreamName=<capture name>
    &FilterPort=<numeric port number>
$ curl -u fmadio:100g "http://192.168.2.75/pcap/single?StreamName=upload_20180702_1503_58&FilterPort=0"  | tcpdump  -r - -nn -XX | head -n 100
11:32:37.575907 66:77:88:99:aa:bb > 00:44:44:44:44:44 Null Information, send seq 0, rcv seq 0, Flags [Command], length 54
        0x0000:  0000 0000 0040 0100 0040 0200 0040 0300  .....@...@...@..
        0x0010:  0040 0400 0040 0500 0040 0600 0040 0700  .@...@...@...@..
        0x0020:  0040 0800 0040 0900 0040 0a00 0040 0b00  .@...@...@...@..
        0x0030:  0040 e59d 3993                           .@..9.
11:32:37.575907 66:77:88:99:aa:bb > 00:33:33:33:33:33 Null Information, send seq 0, rcv seq 0, Flags [Command], length 54
        0x0000:  0000 0000 0030 0100 0030 0200 0030 0300  .....0...0...0..
        0x0010:  0030 0400 0030 0500 0030 0600 0030 0700  .0...0...0...0..
        0x0020:  0030 0800 0030 0900 0030 0a00 0030 0b00  .0...0...0...0..
        0x0030:  0030 52a4 9d2a                           .0R..*
.
.
.
.
.
Download Capture Time Only
Download the capture without name only start/stop times
http://1.1.1.1/pcap/timerange?TSBegin=<Epoch Time Start>&
                                 TSEnd=<Epoch Time Stop>&
                                 TSMode=<Epoch time unit default:nanos (optional)>&
                                 TSMax=<Max time duration (optional)>


TSMode : default is Nanoseconds
       : "msec" Milliseconds
       : "sec" Milliseconds
fmadio@fmadio20v2-149:~$ curl -u fmadio:100g "http://192.168.2.145/pcap/timerange?TSBegin=1497329459948411420&TSEnd=1597329469948411420"  | tcpdump  -r - -nn | head -n 100

00:43:18.033804 CALM FAST src:11:11:11:11:11:11; SrcNwref:17; DstNwref:17;
00:43:18.033804 22:22:22:22:22:22 > 00:22:22:22:22:22, ethertype Unknown (0x2222), length 64:
        0x0000:  2222 9499 f845 9599 f845 9699 f845 9799  ""...E...E...E..
        0x0010:  f845 9899 f845 9999 f845 9a99 f845 9b99  .E...E...E...E..
        0x0020:  f845 9c99 f845 9d99 f845 9e99 f845 4c6f  .E...E...E...ELo
        0x0030:  88df                                     ..
00:43:18.033804 CALM FAST src:11:11:11:11:11:11; SrcNwref:17; DstNwref:17;
00:43:18.033804 22:22:22:22:22:22 > 00:22:22:22:22:22, ethertype Unknown (0x2222), length 64:
        0x0000:  2222 9f99 f845 a099 f845 a199 f845 a299  ""...E...E...E..
        0x0010:  f845 a399 f845 a499 f845 a599 f845 a699  .E...E...E...E..
        0x0020:  f845 a799 f845 a899 f845 a999 f845 9746  .E...E...E...E.F
        0x0030:  7bb3                                     {.
00:43:18.033804 CALM FAST src:11:11:11:11:11:11; SrcNwref:17; DstNwref:17;
00:43:18.033804 22:22:22:22:22:22 > 00:22:22:22:22:22, ethertype Unknown (0x2222), length 64:
        0x0000:  2222 aa99 f845 ab99 f845 ac99 f845 ad99  ""...E...E...E..
        0x0010:  f845 ae99 f845 af99 f845 b099 f845 b199  .E...E...E...E..
        0x0020:  f845 b299 f845 b399 f845 b499 f845 96d7  .E...E...E...E..
        0x0030:  282a                                     (*
00:43:18.033804 CALM FAST src:11:11:11:11:11:11; SrcNwref:17; DstNwref:17;
00:43:18.033804 22:22:22:22:22:22 > 00:22:22:22:22:22, ethertype Unknown (0x2222), length 64:
        0x0000:  2222 b599 f845 b699 f845 b799 f845 b899  ""...E...E...E..
        0x0010:  f845 b999 f845 ba99 f845 bb99 f845 bc99  .E...E...E...E..
        0x0020:  f845 bd99 f845 be99 f845 bf99 f845 30cf  .E...E...E...E0.
        0x0030:  3fad                                     ?.
.
.
.
.
.
System Device Status
Download the capture with using a RegEx DPI filter. This example checks for the case-insensitve string "login"
$ curl -u fmadio:100g "http://192.168.2.75/sysmaster/stats_summary"
{
	"uptime":"0D 7H 16M",
	"packets_received":1454363817,
	"packets_dropped":0,
	"packets_errors":0,
	"packets_captured":1454363968,
	"packets_oldest":"19 May 2014 15:48:38",
	"packets_oldest_ts":"1400482118411568128",
	"capture_days":"1505D  0H 57M",
	"bytes_captured":105800185305,
	"bytes_pending":0,
	"bytes_disk":171117117440,
	"bytes_overflow":0,
	"smart_errors":0,
	"raid_errors":0,
	"raid_status":"clean : raid5",
	"stream_errors":0,
	"chunk_errors":0,
	"ecc_errors":0,
.
.
.
.
.
FMADIO10 and FMADIO20 devices are cost effective line rate 10Gbe and 20Gbe packet capture systems. These systems are designed for simple and easy operation with excellent integration into your existing environment. If you have any further questions or requirements please contact us at any time.

