fmadio.LTE User Manual
Operating manual and Quick Start guide for operation of the fmadio Lite VMWare cloud packet capture appliance.
Contents
- Overview
- Virtual Hardware Setup
- Download Image
- Configuration
- Launch Instance
- Network Config
- Smoke Test
- Firmware Update
- Change Hostname
- Operating
- Capture Start/Stop: Web
- Capture Start/Stop: CLI
- Download PCAP: Web
- Download PCAP: CLI
- Post Capture Packet Filtering & Analysis
- Troubleshooting
- System Log Generation
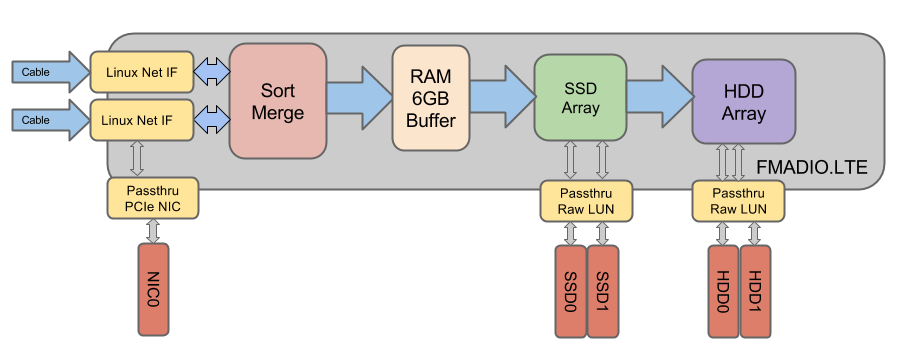
System Architecture
FMADIO.LTE
FMADIO.LTE is a lite/basic packet capture software only applience. It designed for functional testing on our range of 10G to 100G Packet capture systems. Is is not for performance testing as currently the capture rate is very optimial. Aside from the capture rate, the system has the same features and interface as all our hardware products. This enables testing if our system functionality meets your requirements, using your own hardware.
Features:
- Full functionality
- Install OVA image
- Deploy VM instantly
- x2 Linux Kernel Capture Interfaces
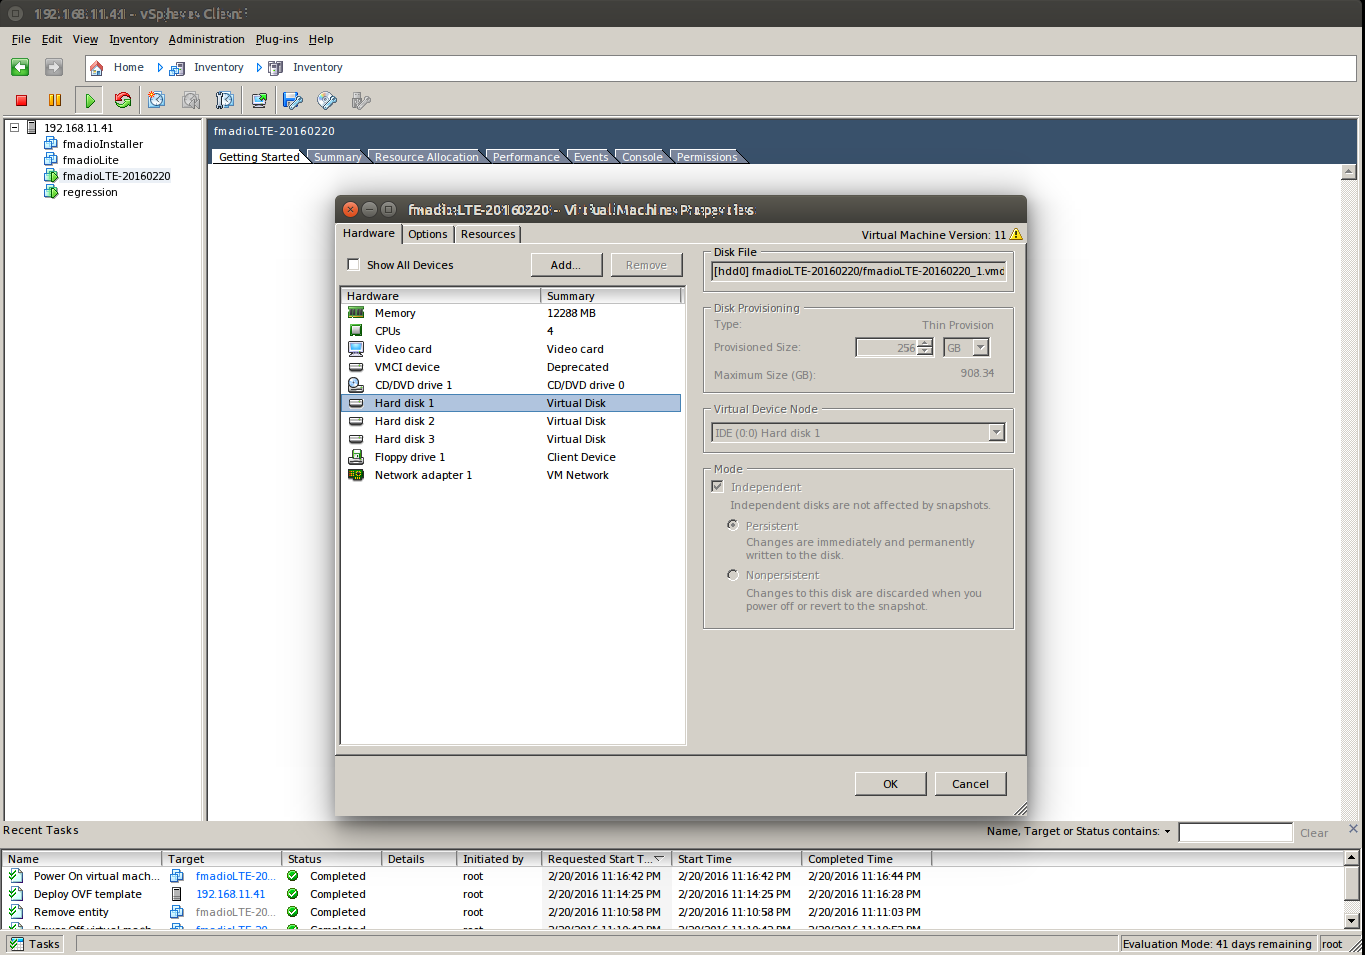
Virtual Hardware Setup
The default VMWareOVA Image has the following hardware specification
Default Specification
- 4 CPU`s
- 12GB RAM
- 256GB OS Virtual IDE Disk
- 128GB Packet Cache Virtual IDE Disk
- 128GB Packet Store Virtual IDE Disk
- PCIe Passthough Network Interface
Recomended Specification
- 8 CPU`s
- 12GB RAM
- 256GB OS Virtual IDE Disk
- x1 SSD Device Raw LUN Passthough
- x1 HDD Device Raw LUN Passthough
- PCIe Passthough Network Interface
Passthough Network Interface
As packet capture requires a real physical network port, fmadioLTE requires atleast 1 PCIe passthough network device to be setup. Intel based NIC`s are recomended such as the 10G X520 or X520-DA2 for full DPDK support and thoughput.
Passthough Block Devices
Pass though block devices are recommened (but not required). For maximum performance all FMADIO Packet capture systems write directly to storage devices. As such we recommend at minimum 1 SSD drive be passed though to the GuestVM for the packet capture`s cache.
Download Software
Download the latest VMWare OVA Image`s and binary firmware HERE. Contact us for the password login.
Setup the VM
Step 1) Import the OVA file to vSphere. Our test environment is ESXi 6 Hypervisor.
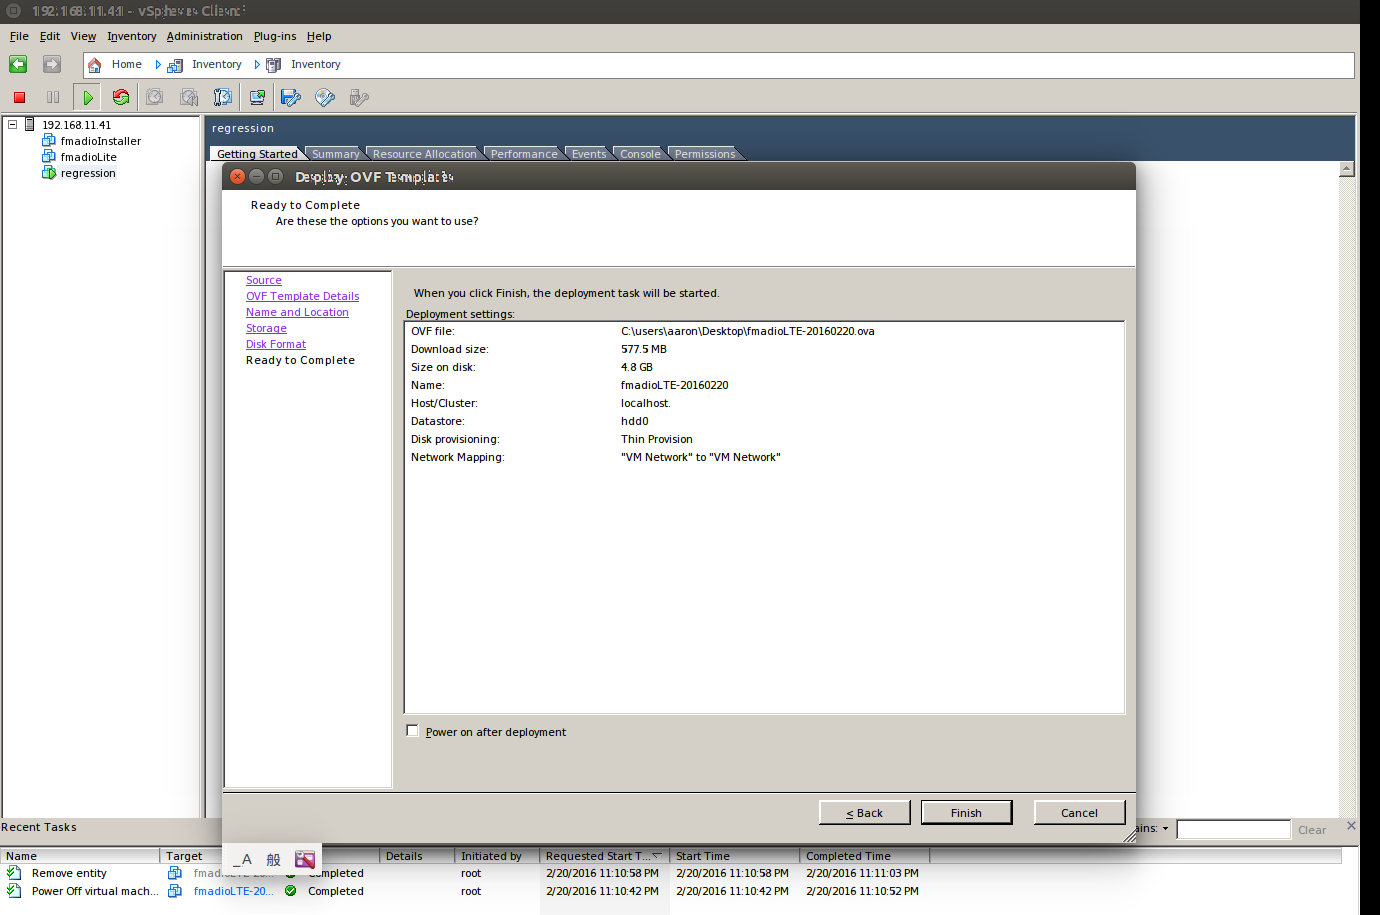
Step 2) Launch the VM.
By default its configured with 1 Virtual IDE drive for Cache, and 1 Virtual IDE drive for Storage. This will be changed later
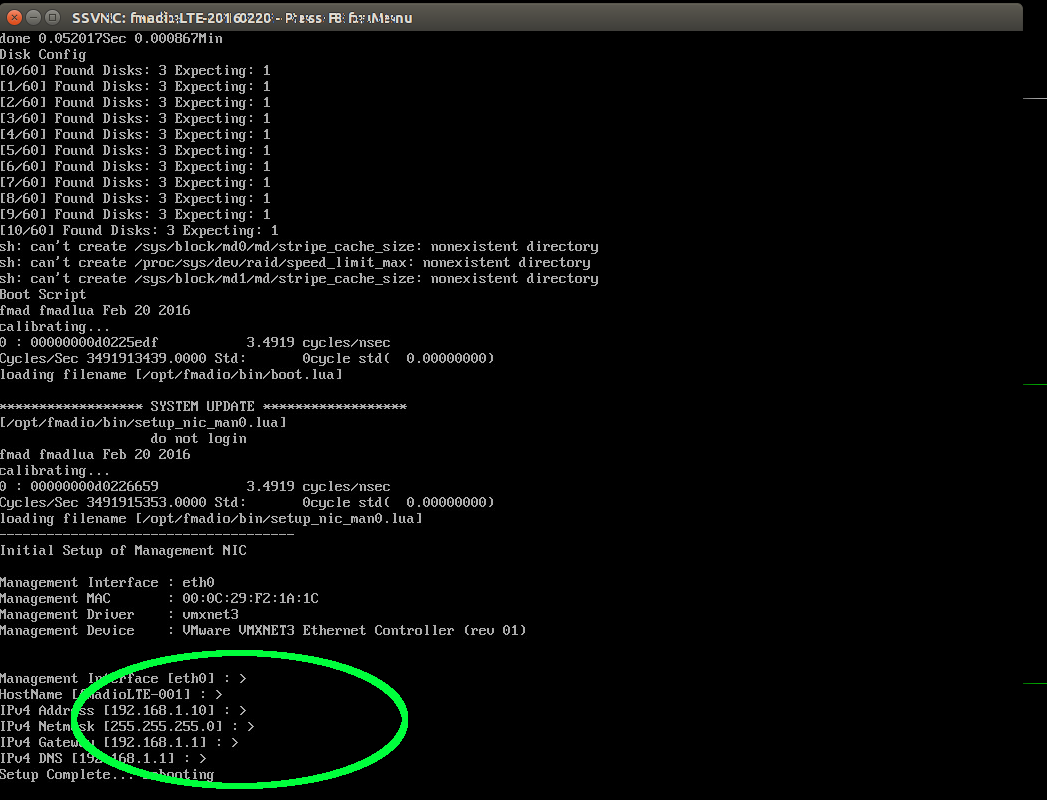
Step 3) Setup HostName + Management IP Address.
By default the IP address is 192.168.1.10/24 please change to the appropriate setting.
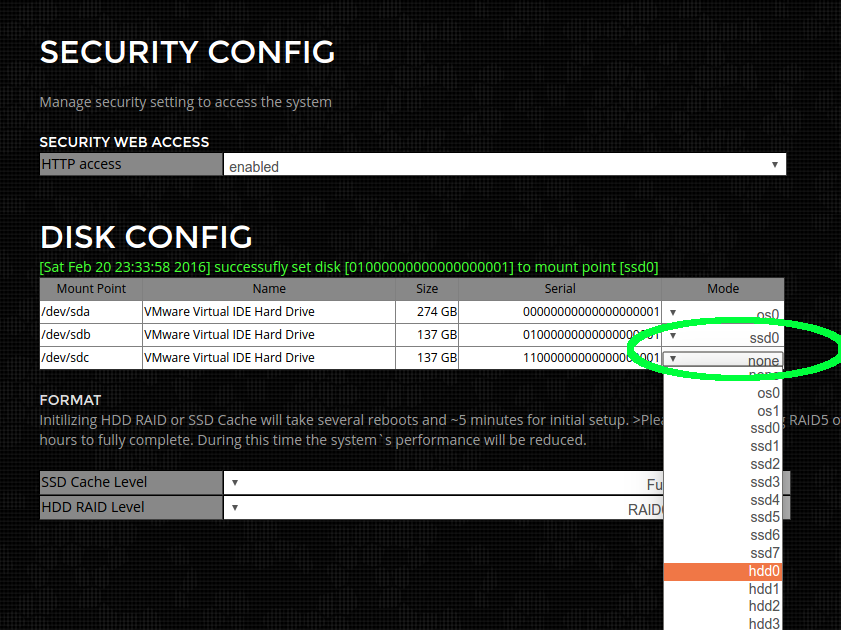
Step 4) User the browser and point to the Management IP set in step 3)
Go to the configuration page and setup the disk config as shown in green
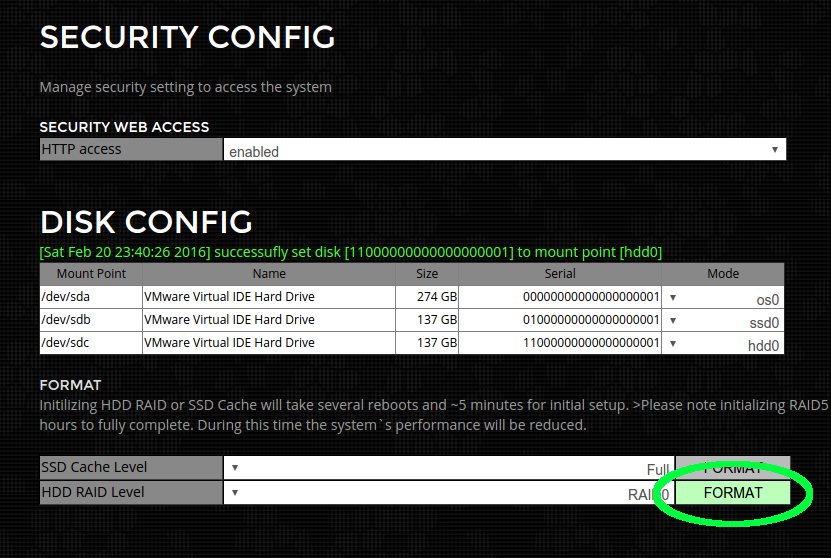
Step 5) Format the storage array
As there is only 1 HDD in the system RAID0 is the only choice. RAID0 format will take ~ 5 minutes and reboot the machine several times.
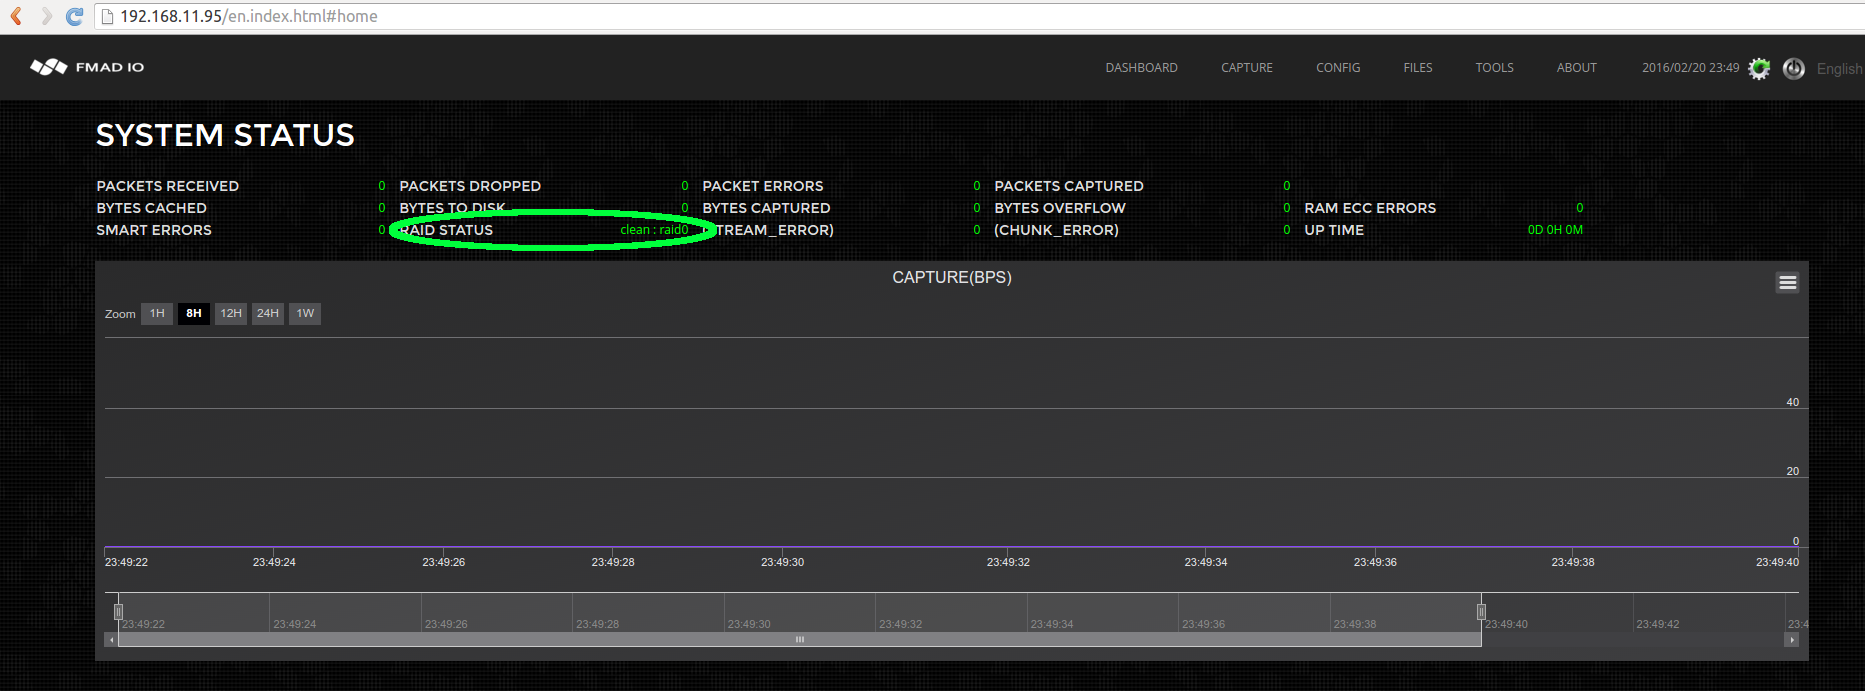
Step 6) After RAID setup confim status
Point the browser to the Management IP address to get the dashboard screen. Note the RAID status as hilighted in green
Step 7) Add NIC PCIe Passthru settings to VM Config
Power down the capture VM and add PCIe pass-thru devices to the VM. In this case we`re adding dual port Solarflare NIC. Re-start the VM.
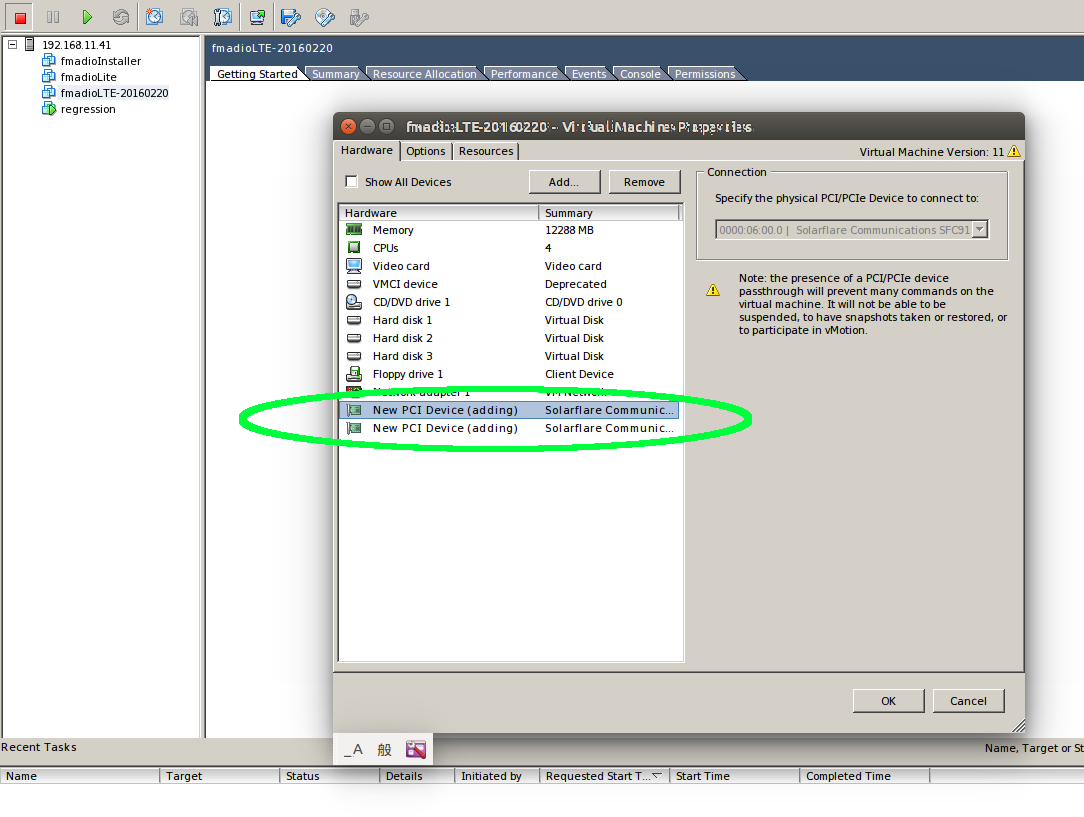
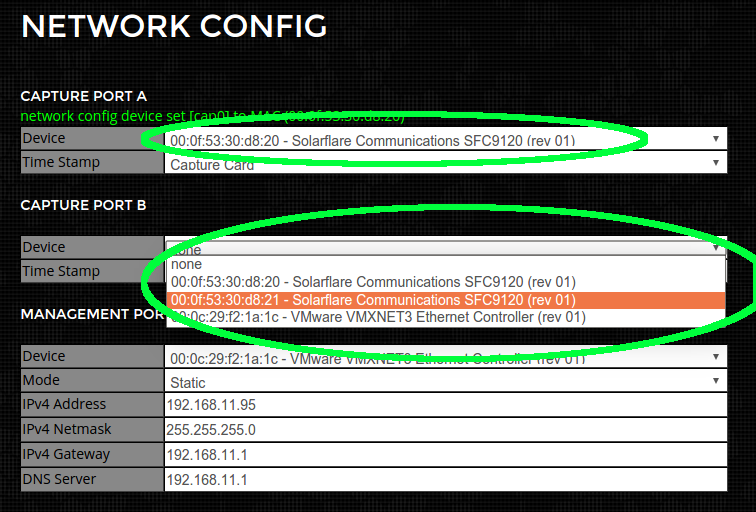
Step 8) Finally Select the Caputre NIC Interfaces
Select the Capture NIC interfaces from the drop down menu. Afte one (or both) interfaces have been set reboot the machine.
Step 9) Finished
System is not ready for packet capture.
Firmware Update
Firmware updates are simple and easy that enables the latest updates and system features. Please follow these steps to update the system.
Step 1) Download the latest firmware
Download the latest firmware image from the support web site.
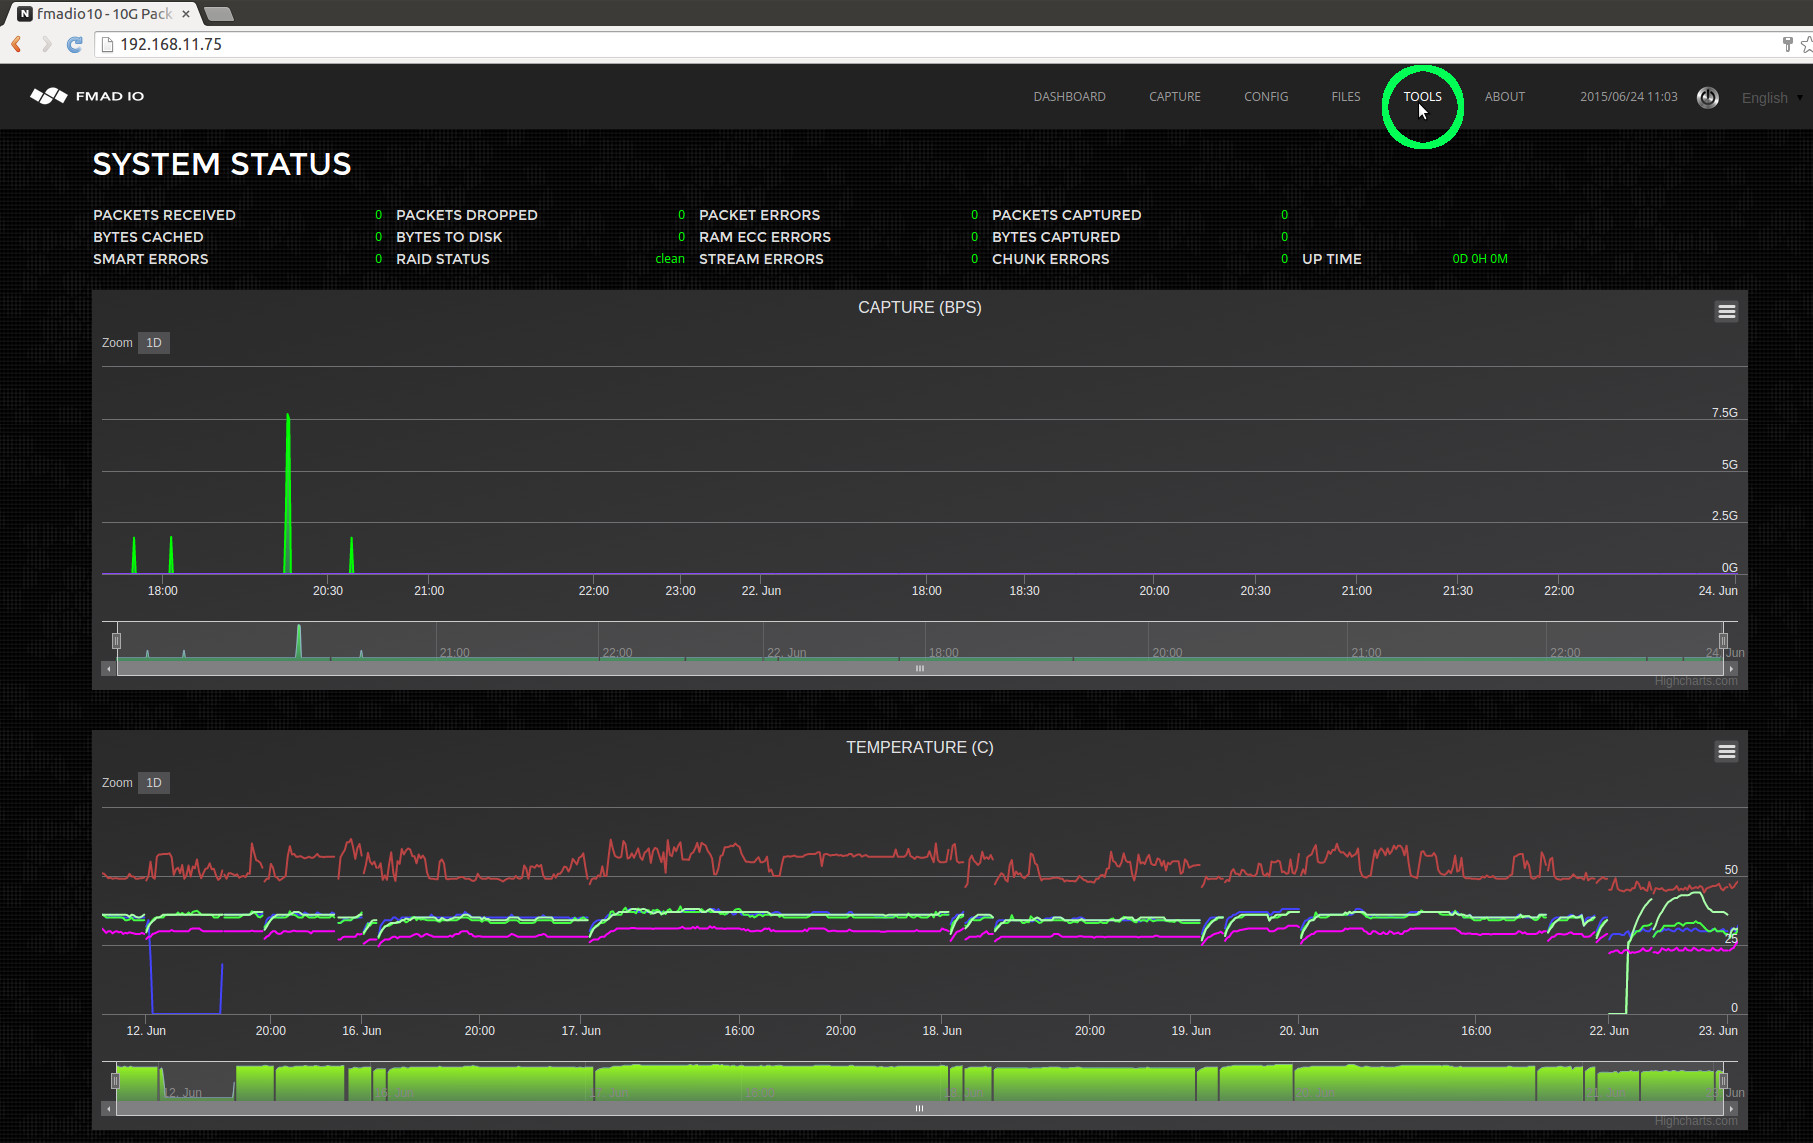
Step 2) Select Firmware web page
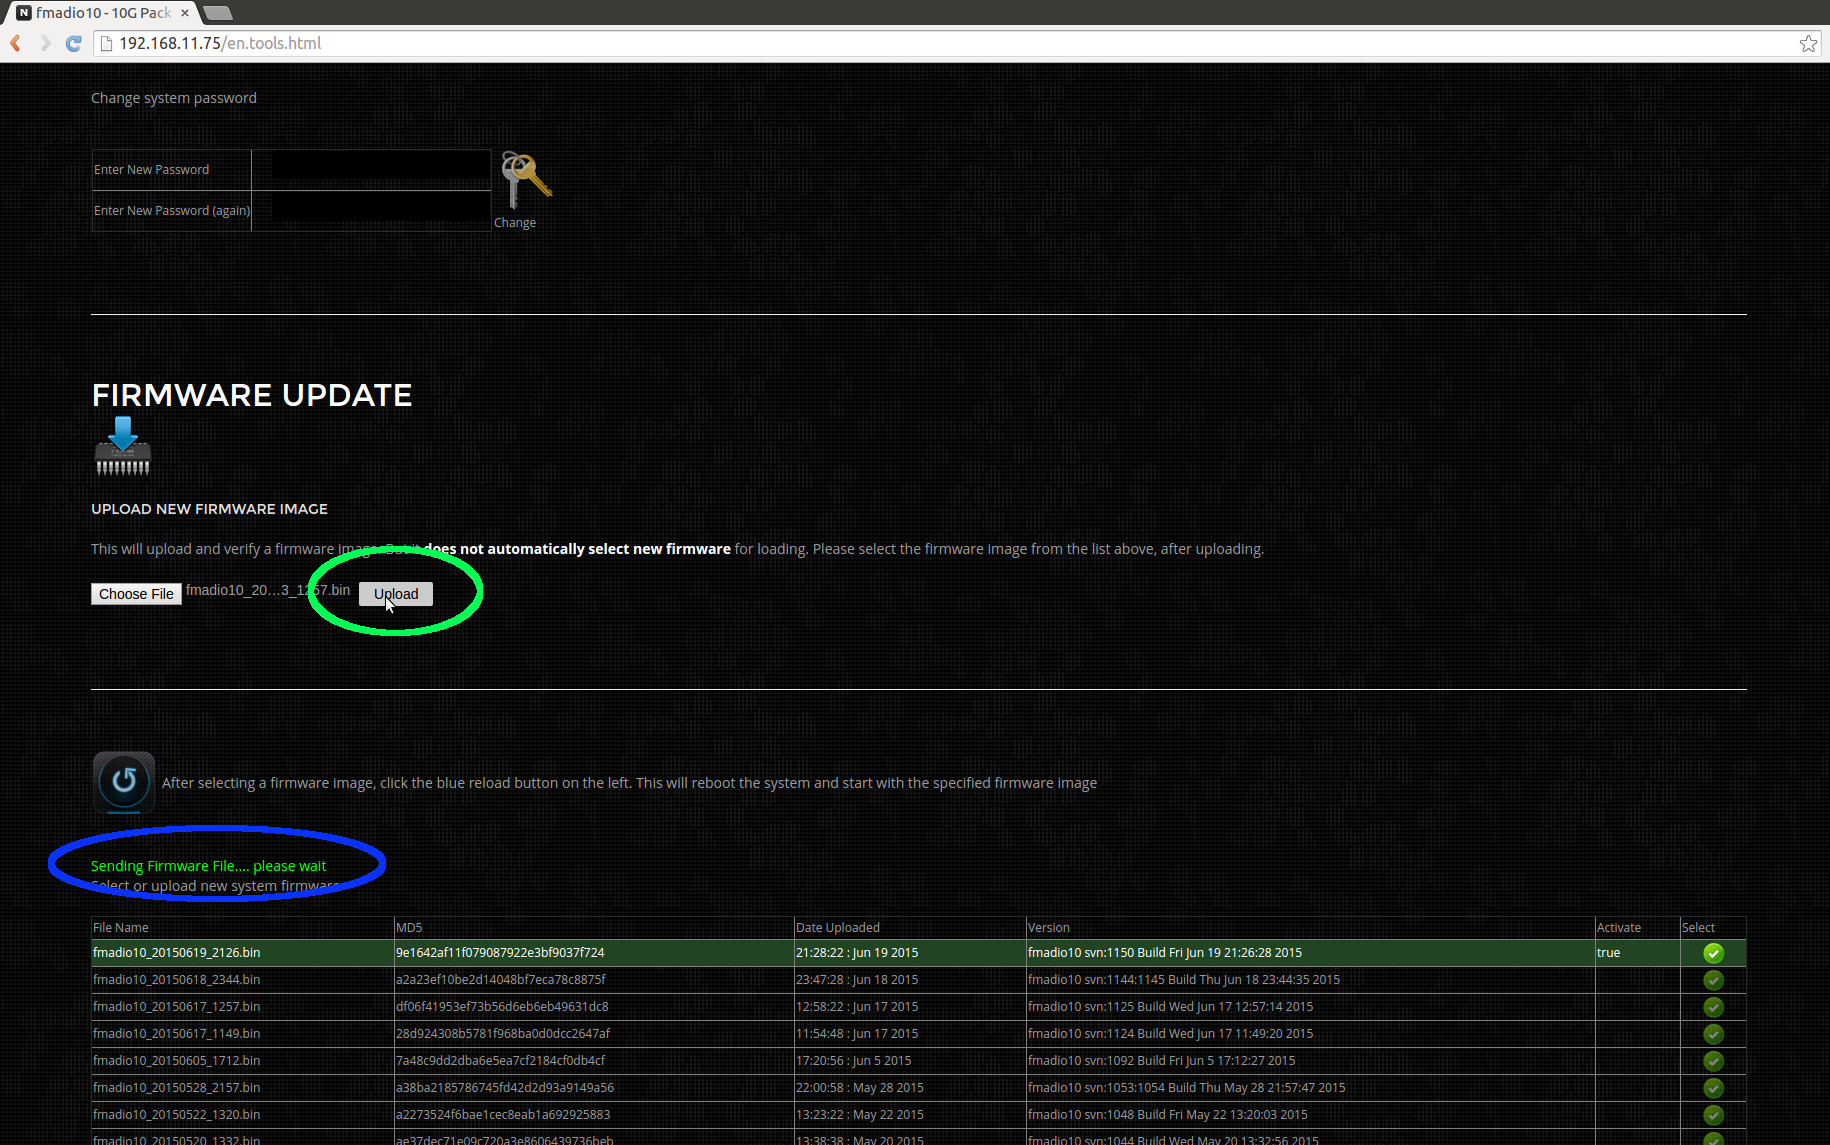
Proceed to the "Tools" page on the capture device`s web page, as highlighted in green in the image below.
Step 3) Select the firmware binary to upload
Scroll down on the Tools page to find and select the "Choose File" firmware button (highlighted in green below)
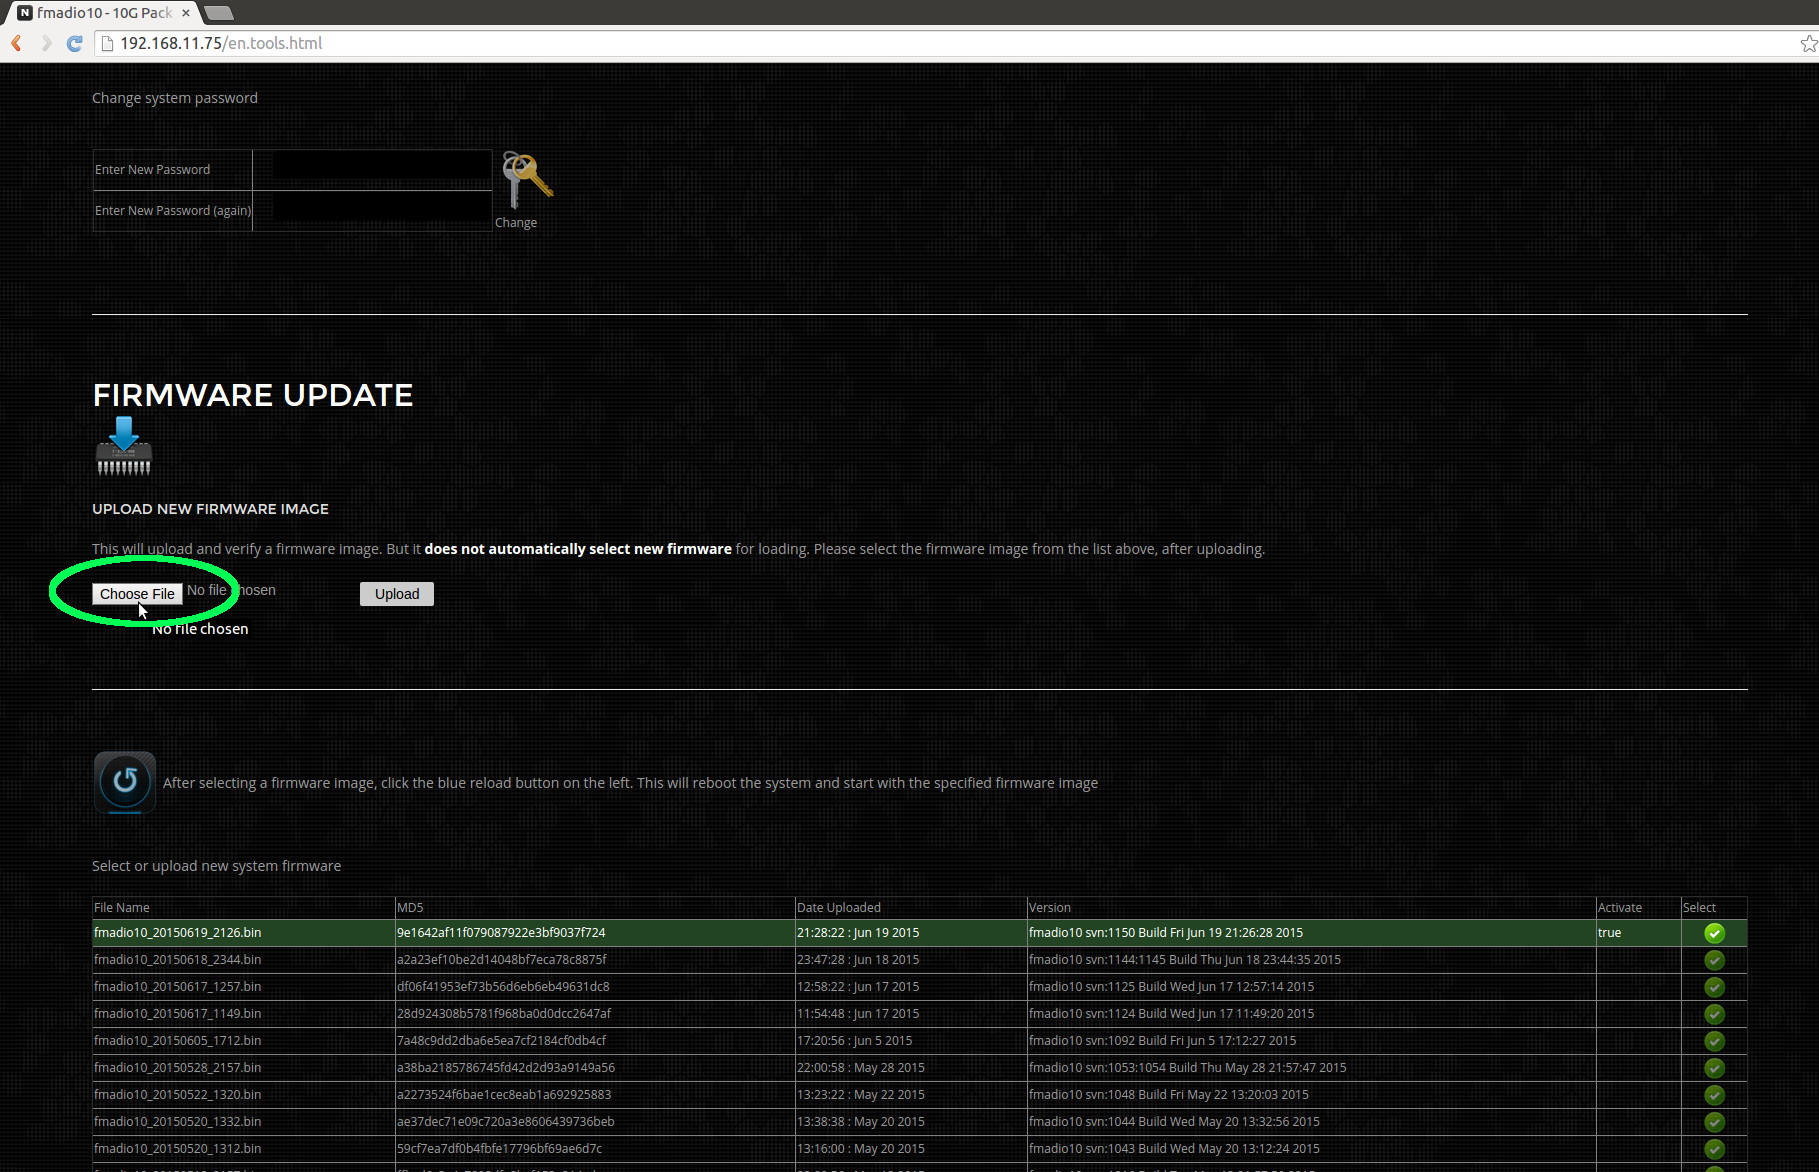
Step 4) Upload the binary
After selecting the appropriate file (in this example fmadio10_20150623_1257.bin) click the upload button to transfer to the capture device. NOTE: this will not change the firmware on the device, only upload it.
The upload status is highlighted in blue below.
Step 5) Verify firmware was uploaded
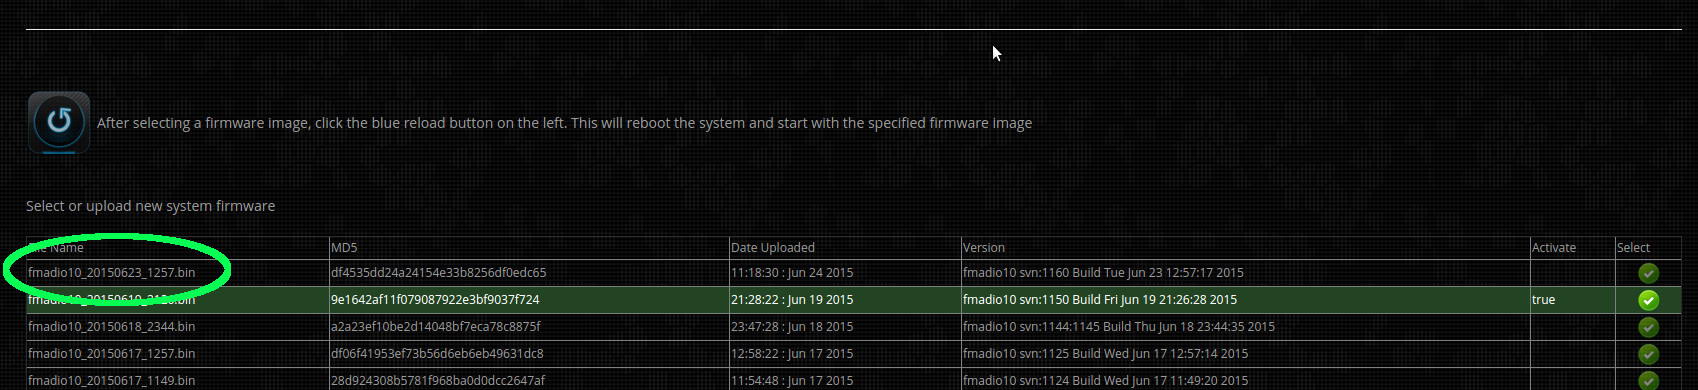
After successfully uploading the firmware, the web page will refresh and show a new entry in the firmware list, as shown in green below.
Step 6) Select firmware and reboot
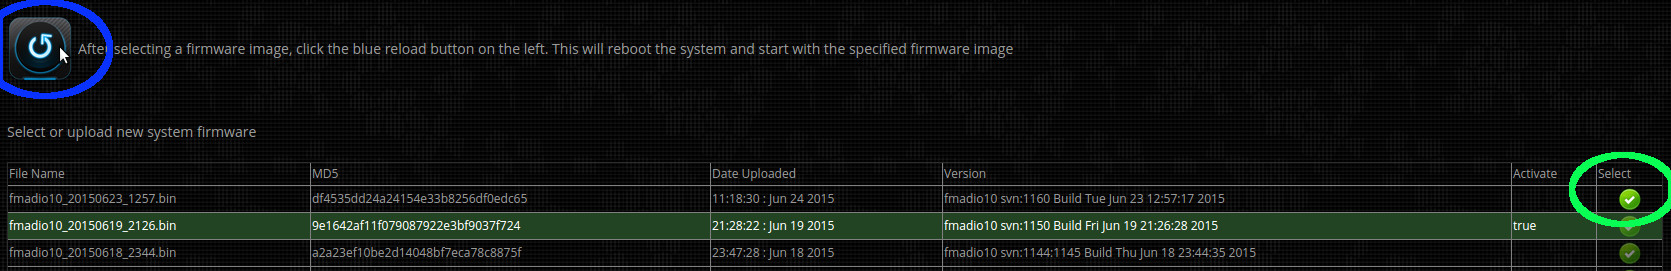
Select the new firmware image by clicking on the green icon (highlighted in green below). The green select button (it will remain highlighted).
After selecting which firmware to use, request the system to update then reboot (highlighted in blue below)
Step 7) Confirm new firmware
It will take 1-2 minutes for the system to reboot and become active again. Once the system is online go to the tools page in the browser and confirm the currently active firmware image is the one just uploaded and selected.
System updates are easy and simple. The device is designed for regular updates as we are constantly adding additional features based on customer requests. This is NOT a standard redhat/ubuntu based linux system, it is a highly customized and controlled embedded linux device.
Think of our devices as Network Switch`s that do Packet Capture.
Change Hostname
Having the appropriate hostname can make server management alot simpler. By default all systems have a "fmadio-XXX" host name that is unique to each system deployed. Changing the host name is simple with the following steps
Step 1) Log into the system
SSH into the fmadio10 device
$ ssh fmadio@192.168.11.75
fmadio@192.168.11.75's password:
  _____                    .___.__      10G
_/ ____\_____  _____     __| _/|__|  ____
\   __\/     \ \__  \   / __ | |  | /  _ \
 |  | |  Y Y  \ / __ \_/ /_/ | |  |(  <_> )
 |__| |__|_|  /(____  /\____ | |__| \____/
            \/      \/      \/
============================================
  -+ no user serviceable parts inside +-

fmadio@fmadio10-049:~$
Step 2) Change to the configuration directory
fmadio@fmadio10-049:~$ cd /mnt/store0/etc
fmadio@fmadio10-049:/mnt/store0/etc$
Step 3) Display the current host name
fmadio@fmadio10-049:/mnt/store0/etc$ cat hostname
fmadio10-049
fmadio@fmadio10-049:/mnt/store0/etc$
Step 4) Set new hostname
Use your preferred editor or even command to edit the hostname file. For example:
fmadio@fmadio10-049:/mnt/store0/etc$ sudo echo "my.new.hostname" > hostname
fmadio@fmadio10-049:/mnt/store0/etc$
Step 5) Power cycle the system
For the change to take effect, please reboot the system.
fmadio@fmadio10-049:/mnt/store0/etc$ sudo reboot
fmadio@fmadio10-049:/mnt/store0/etc$ Connection to 192.168.11.75 closed by remote host.
Step 6) Complete
Next time you login the hostname is the new updated value, in this case "my.new.hostname"
fmadio@my.new.hostname:/mnt/store0/etc$
Capture Start&Stop (Web)
Starting a capture manually can be performed using the Web interface or via Command Line Interface(CLI) from a remote machine. In most cases captures are started using the Scheduled Captures feature however there are many cases when starting an immediate capture is required.
Web Interface: Start Capture
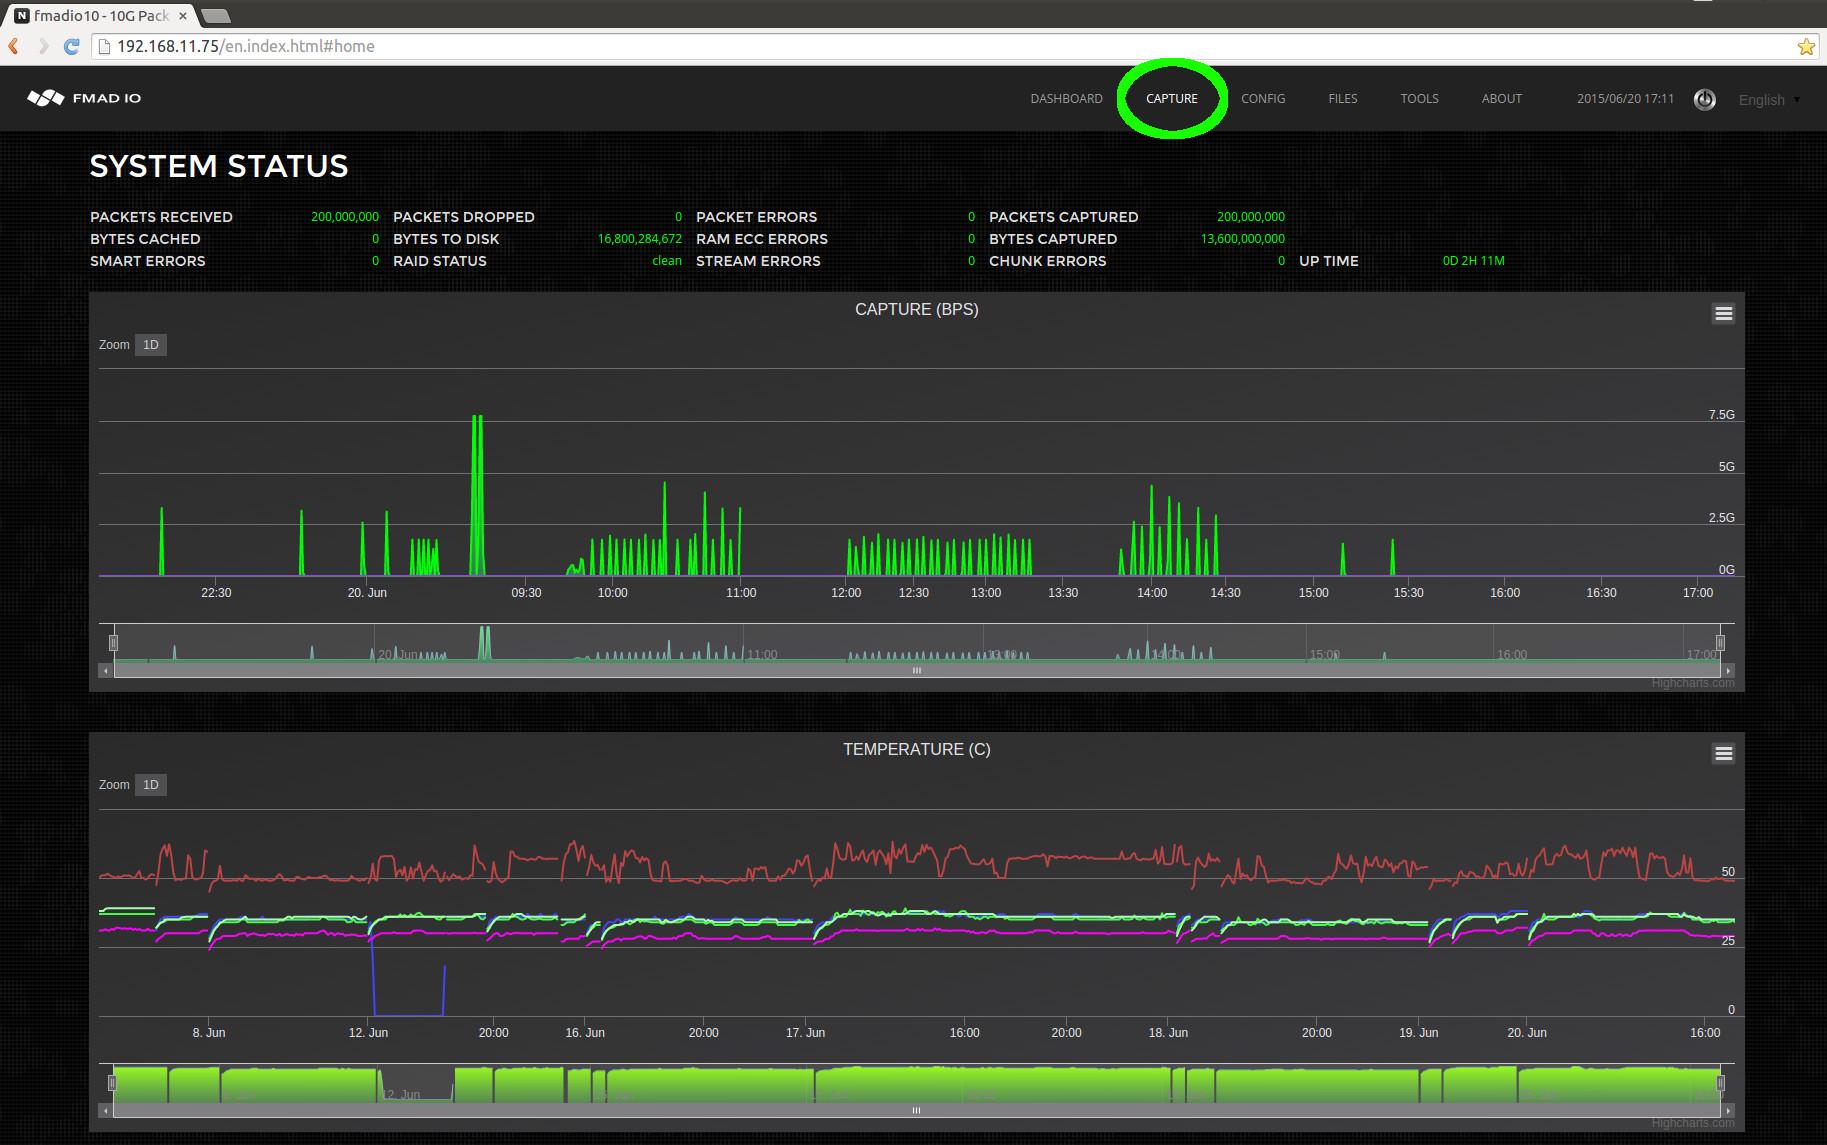
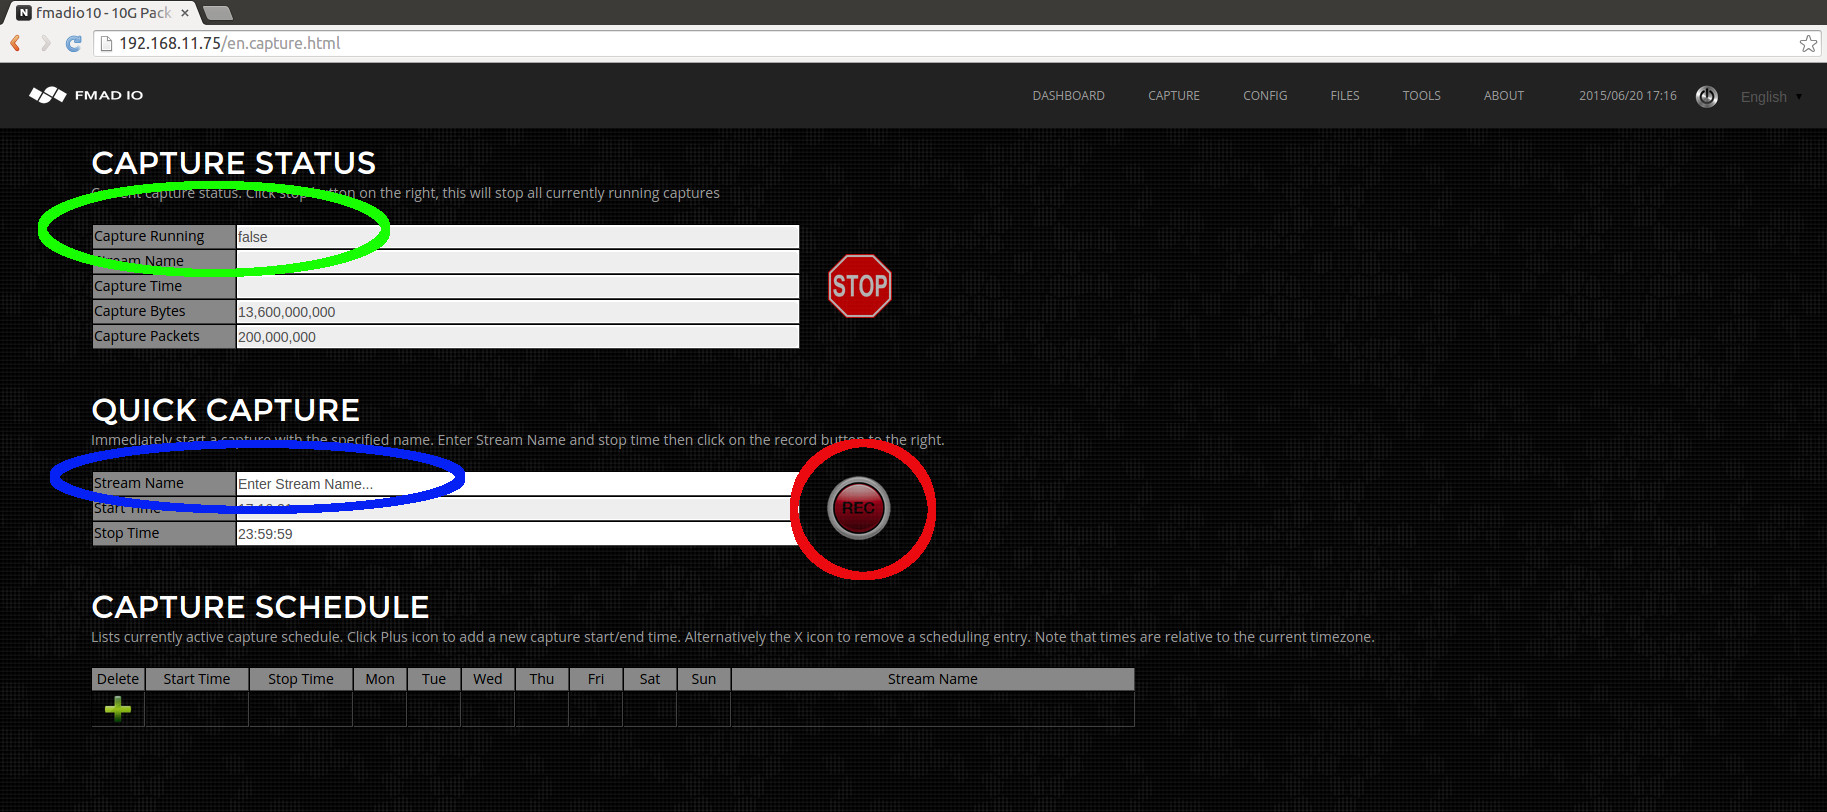
From the dashboard Start by selecting the Capture menu option as highlighted in green below.
From the capture page below we can see there is no capture running (highlighted in green below).
The steps to start a capture immediately:
- 1) Enter a new capture name, in this example we enter "manual_capture" (highlighted in blue below)
- 2) Start the capture by clicking on the Rec(ord) button (highlighted in red below)
After clicking the REC button the web page will update as shown in the image below.
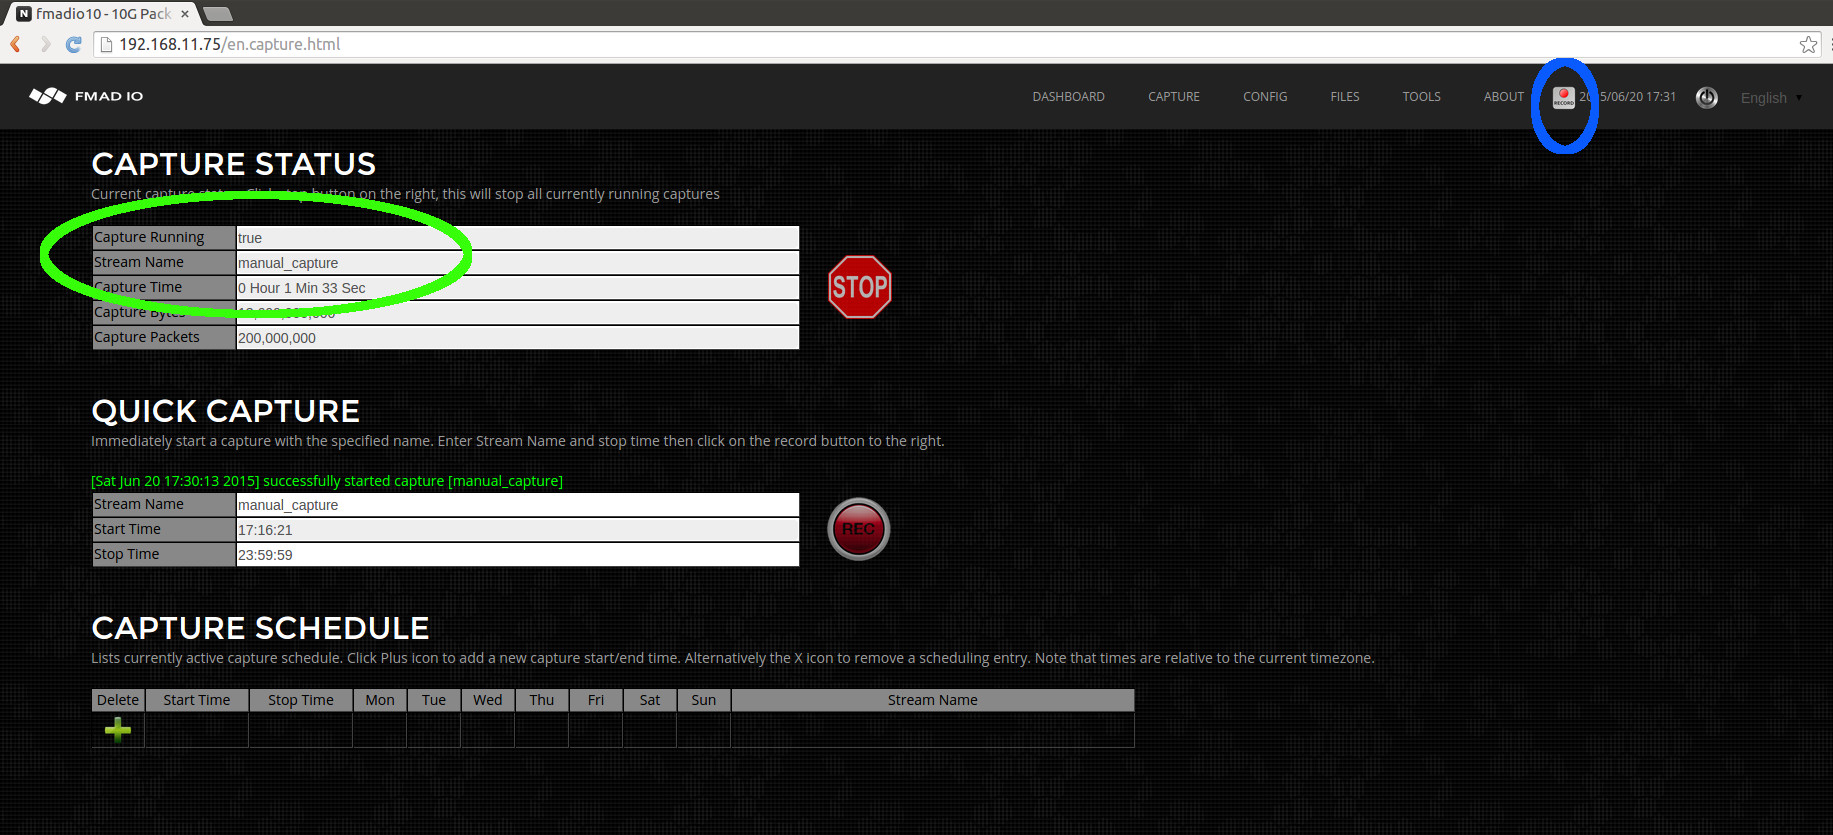
We can see the capture status (highlighted in green above). This shows the capture is running, the capture name, how long it has been running and how many bytes/packets have been captured. Also (highlighted in blue above) on all web pages it shows a small REC icon to show the system is currently in a active capture state.
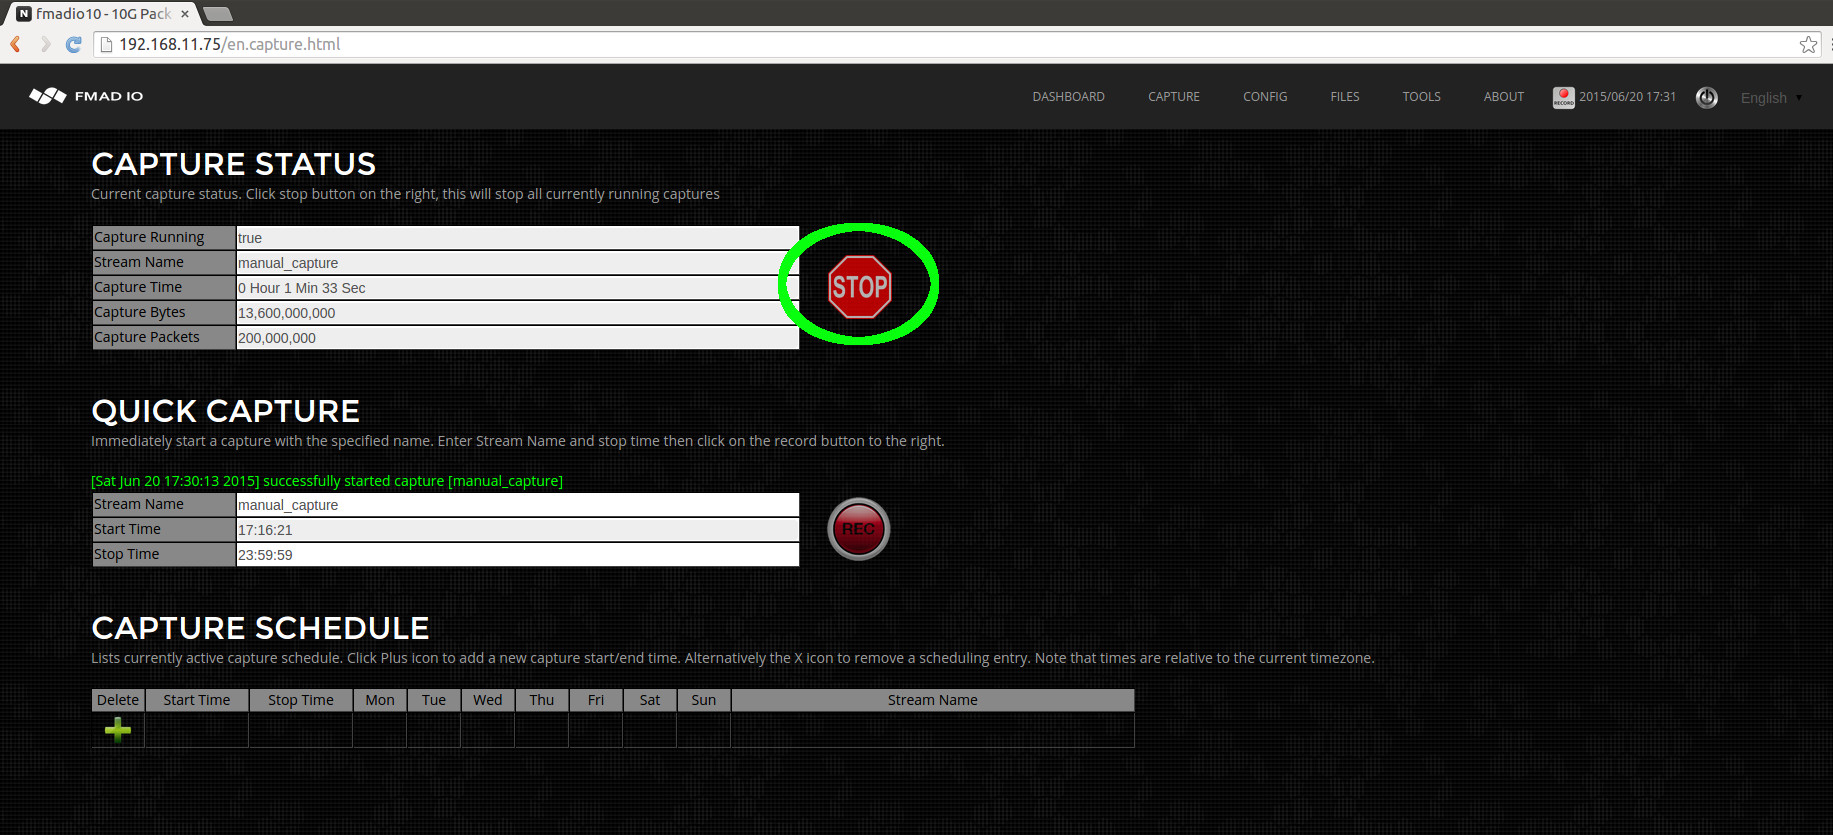
Web Interface: Stop capture
To stop any capture (both manual and scheduled) simply click on the STOP button as highlighted in green below.
After stopping the web UI will look like the image below.
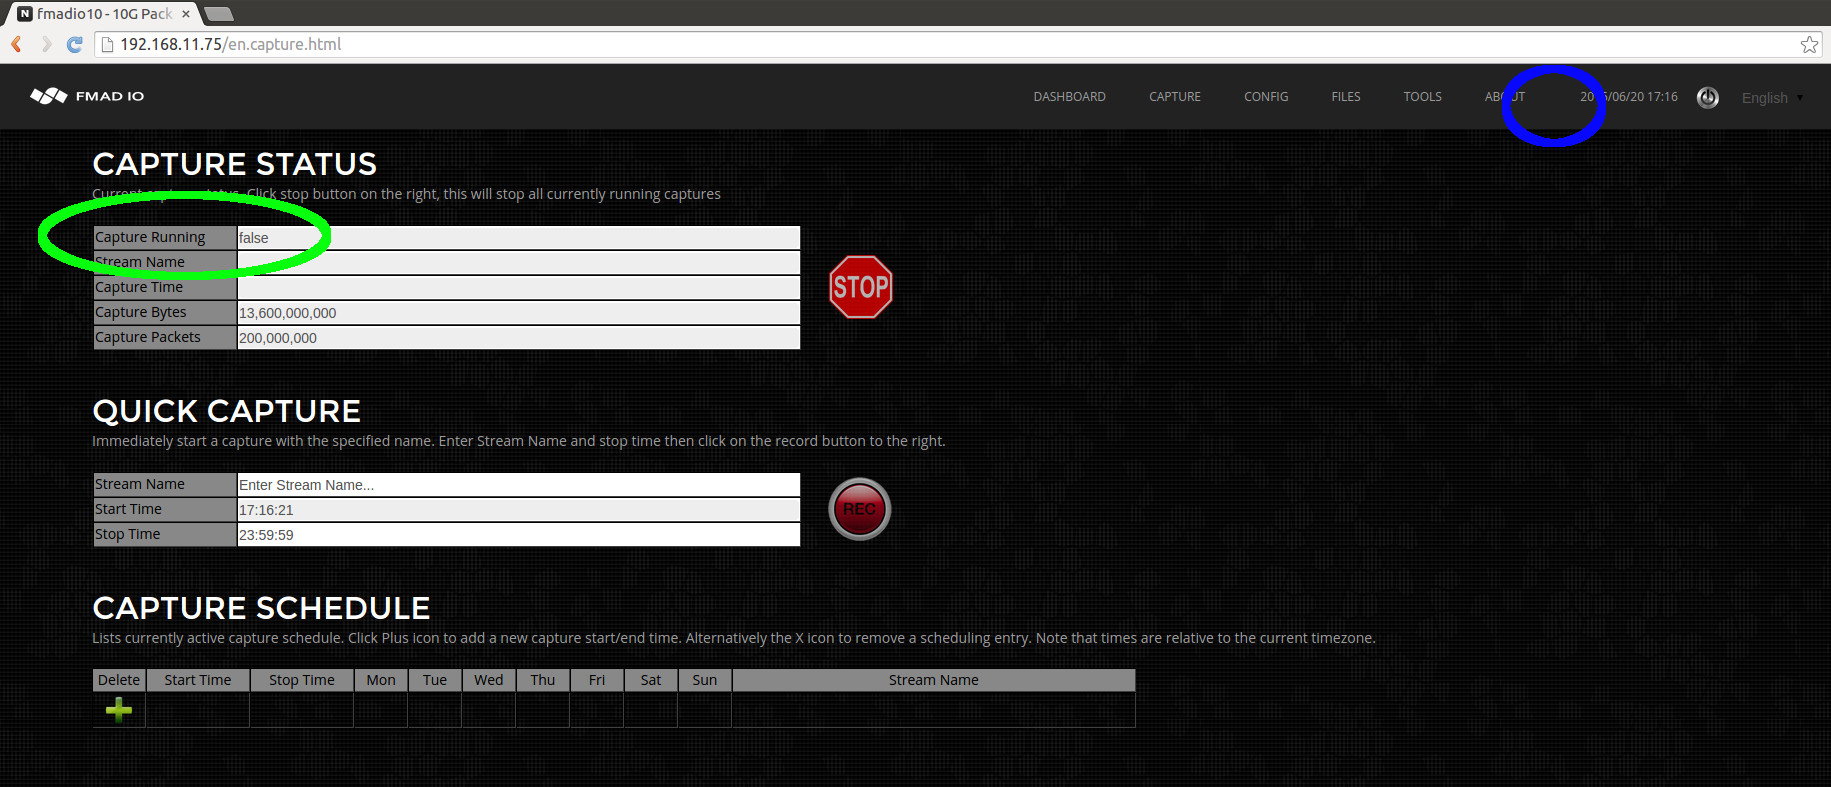
Where the status shows no capture running, "Capture Running: false" (highlighted in green above). In addition, as no capture is active the recording toolbar icon visible on all web pages is now gone (blank space highlighted in blue above).
It is a clean and simple interface. If anything is unclear please contact us support @ fmad .io and we are happy to assist.
Capture Start&Stop (CLI)
Starting and stopping captures manually using the Command Line Interface (CLI) is extremely simple. It requires a correctly formatted URL request. In the examples below we use CURL but any program with HTTP functionality will work. Note that in the examples below the username is "user" and the password is "password", please replace with the correct information.
CLI Interface: Capture Status
Before starting and stopping captures, its helpful to check the current systems capture status. The following URL returns the current system status.
curl "http://fmadio.probe.ip/sysmaster/status"
For example when the packet sniffer is active and capturing data, the output will look like the below text
$ curl -u user:pass "http://192.168.11.75/sysmaster/status"
uptime,                                             0D 3H 36M
packets_received,                                   453468480
packets_dropped,                                            0
packets_errors,                                             0
packets_captured,                                   453468480
bytes_captured,                                   30835857408
bytes_pending,                                     4812701696
bytes_cache,                                                0
bytes_disk,                                       33742389248
capture_link,                                              up
capture_link_uptime,                                0D 3H 36M
capture_link_speed,                                     10000
capture_bytes,                                    31705286552
capture_packets,                                    466254210
capture_bps,                                       7726900224
capture_pps,                                         14203859
capture_name,                              manual_capture_cli
capture_active,                                          true
And when the system is not capturing, it looks like the following below
$ curl -u user:pass "http://192.168.11.75/sysmaster/status"
uptime,                                             0D 3H 28M
packets_received,                                   400000000
packets_dropped,                                            0
packets_errors,                                             0
packets_captured,                                   400000000
bytes_captured,                                   27200000000
bytes_pending,                                              0
bytes_cache,                                                0
bytes_disk,                                       33600831488
capture_link,                                              up
capture_link_uptime,                                0D 3H 28M
capture_link_speed,                                     10000
capture_bytes,                                    27200000000
capture_packets,                                    400000000
capture_bps,                                                0
capture_pps,                                                0
capture_name,                                            none
capture_active,                                         false
As you can see this is a simple format that's easy to parse, and excellent for compact monitoring scripts to use. For example:
$ curl -s -u user:pass "http://192.168.11.75/sysmaster/status" | grep capture_active
capture_active,                                          true
CLI Interface: Start Capture
Starting captures from the CLI is also extremely easy, using the following URL format
http://capture.sys.ip/sysmaster/capture_start?StreamName=enter_stream_name_here
This will start a capture and return in JSON format the result of the request. The following example starts a capture with the name "cli_capture", then confirms its capture status
$ curl -u user:pass "http://192.168.11.75/sysmaster/capture_start?StreamName=cli_capture"
{"Status":true,"Str":"[Sat Jun 20 20:28:55 2015] successfully started capture [cli_capture]"}


$ curl -u user:pass "http://192.168.11.75/sysmaster/status"
uptime,                                              0D 0H 3M
packets_received,                                           0
packets_dropped,                                            0
packets_errors,                                             0
packets_captured,                                           0
bytes_captured,                                             0
bytes_pending,                                              0
bytes_cache,                                                0
bytes_disk,                                       22325755904
capture_link,                                              up
capture_link_uptime,                                 0D 0H 3M
capture_link_speed,                                     10000
capture_bytes,                                              0
capture_packets,                                            0
capture_bps,                                                0
capture_pps,                                                0
capture_name,                                     cli_capture
capture_active,                                          true
CLI Interface: Stop Capture
Stopping captures via CLI is even simpler as it does not require a stream name. Use the following URL to stop any captures currently running.
http://capture.sys.ip/sysmaster/capture_stop
The following example shows the previous capture state, stopping the capture and verifying capture has stopped.
$ curl -u user:pass "http://192.168.11.75/sysmaster/status"
uptime,                                              0D 0H 9M
packets_received,                                   101000000
packets_dropped,                                            0
packets_errors,                                             0
packets_captured,                                   101000000
bytes_captured,                                    6867999744
bytes_pending,                                     7142375424
bytes_cache,                                                0
bytes_disk,                                       23657971712
capture_link,                                              up
capture_link_uptime,                                 0D 0H 9M
capture_link_speed,                                     10000
capture_bytes,                                     6868000000
capture_packets,                                    101000000
capture_bps,                                                0
capture_pps,                                                0
capture_name,                                     cli_capture
capture_active,                                          true


$ curl -u user:pass "http://192.168.11.75/sysmaster/capture_stop"
{"Status":true,"Str":"[Sat Jun 20 20:39:17 2015] successfully stopped capture [cli_capture]"}


$ curl -u user:pass "http://192.168.11.75/sysmaster/status"
uptime,                                             0D 0H 11M
packets_received,                                   101000000
packets_dropped,                                            0
packets_errors,                                             0
packets_captured,                                   101000000
bytes_captured,                                    6867999744
bytes_pending,                                              0
bytes_cache,                                                0
bytes_disk,                                       30809784320
capture_link,                                              up
capture_link_uptime,                                0D 0H 11M
capture_link_speed,                                     10000
capture_bytes,                                     6868000000
capture_packets,                                    101000000
capture_bps,                                                0
capture_pps,                                                0
capture_name,                                            none
capture_active,                                         false
Very simple and very easy so you spend time on the important tasks.
CLI Interface: Summary
Quick summary of CLI operations follows:
| Operation | URL |
| Start Capture |
http://capture.sys.ip/sysmaster/capture_start?StreamName=insert_stream_name_here
|
| Stop Capture |
http://capture.sys.ip/sysmaster/capture_stop
|
| Capture Status |
http://capture.sys.ip/sysmaster/status
|
PCAP Download (Web)
Simple and intuitive downloading of PCAP`s is an important design goal of the FMADIO capture system. The FMADIO capture system provides simultaneous multiple views of the data for example 1 second PCAP split, 1 hour PCAP splits, 1GB splits and many more. Of course fetching the entire PCAP as a single file is also supported.
The list of supported PCAP split options is as follows.
- Single file
- Split 1 Second
- Split 10 Second
- Split 1 Minute
- Split 10 Minute
- Split 15 Minute
- Split 1 Hour
- Split 1 MB size
- Split 10 MB size
- Split 100 MB size
- Split 1 GB size
- Split 10 GB size
- Split 100 GB size
- Split 1 TB size
All views/splits are available for every capture simultaneously
You can view, download or analyze captures with a 1 hour split but also 1 second split without any configuration changes. Our highly optimized software enables splitting captures in multiple ways enabling efficient network trouble shooting.
Web: Download PCAP
Start by accessing the File menu as highlighted in green below.
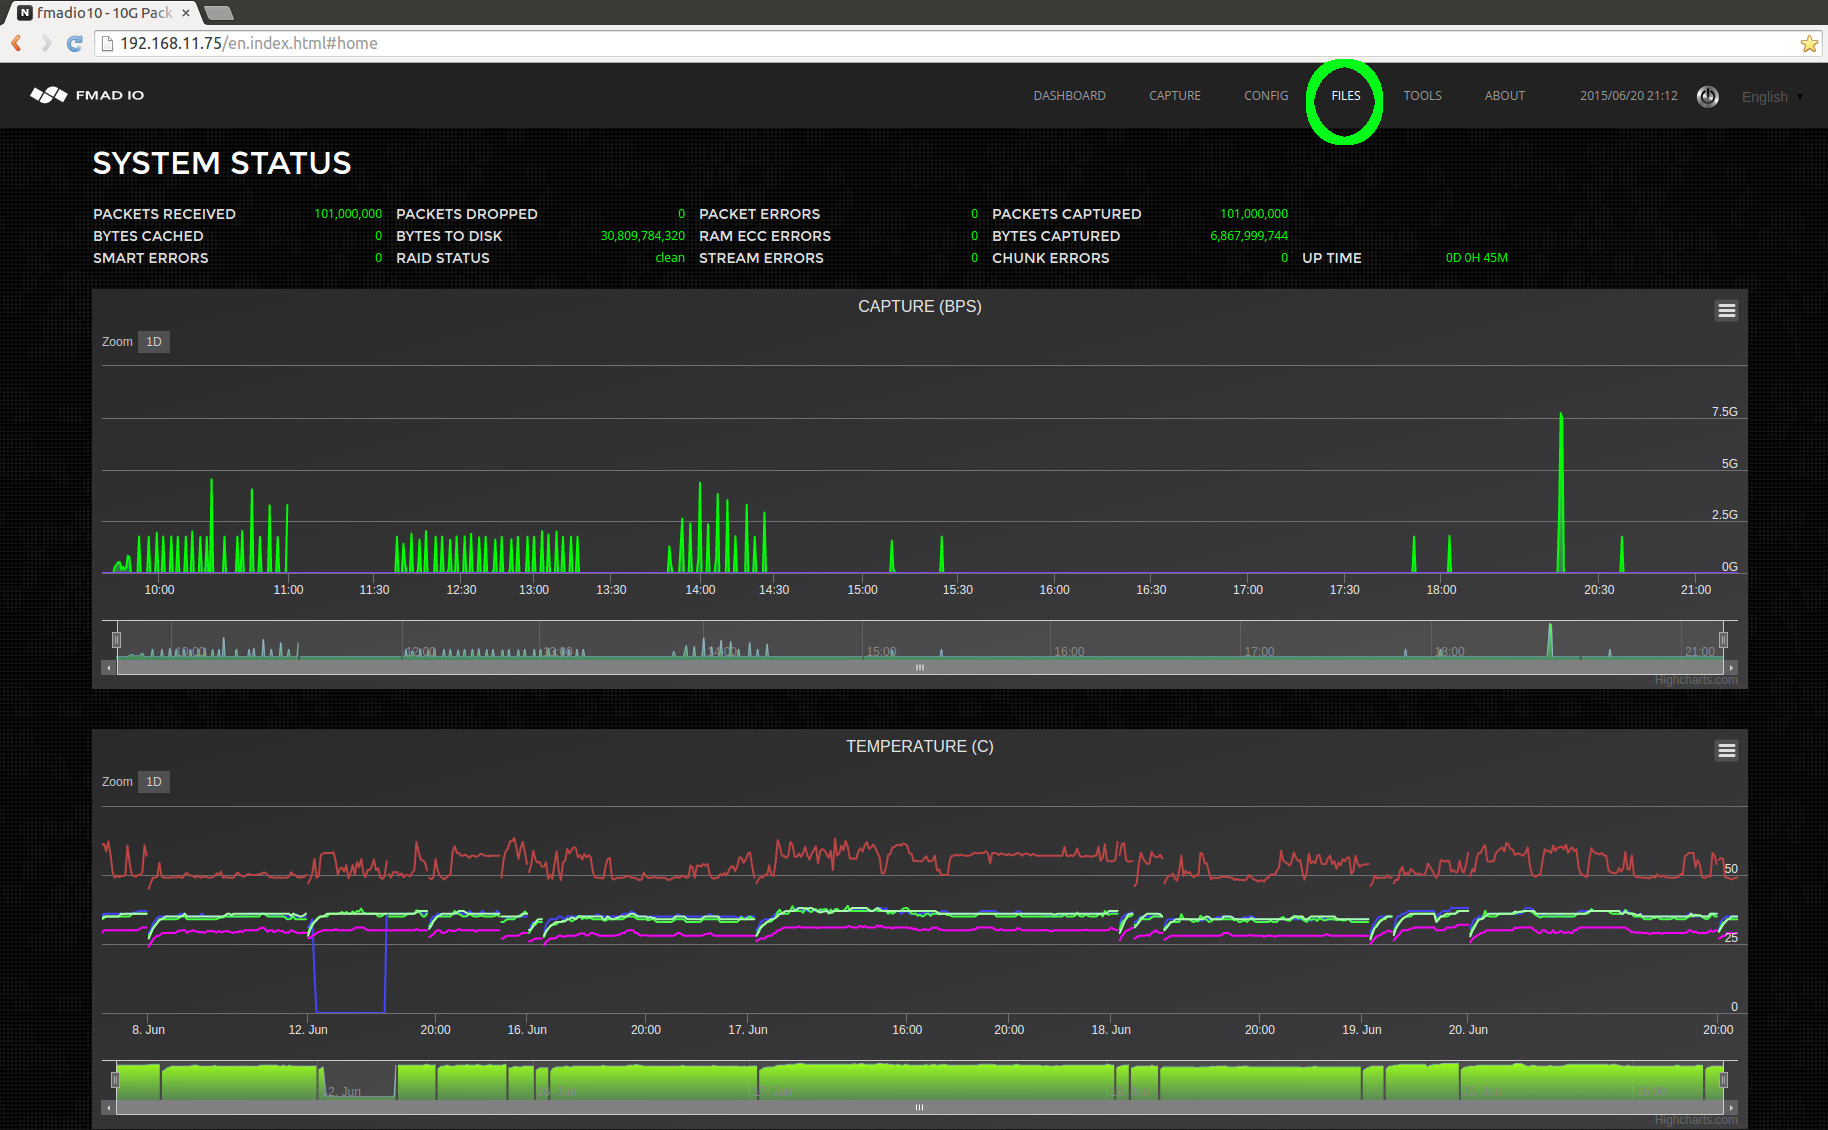
After clicking on the Files menu, it shows all captures captures currently on the system. In the example below we want the capture named "manual_capture_cli_20150620_1836", the icon highlighted in blue is a quick link to download the entire capture as a single PCAP file.
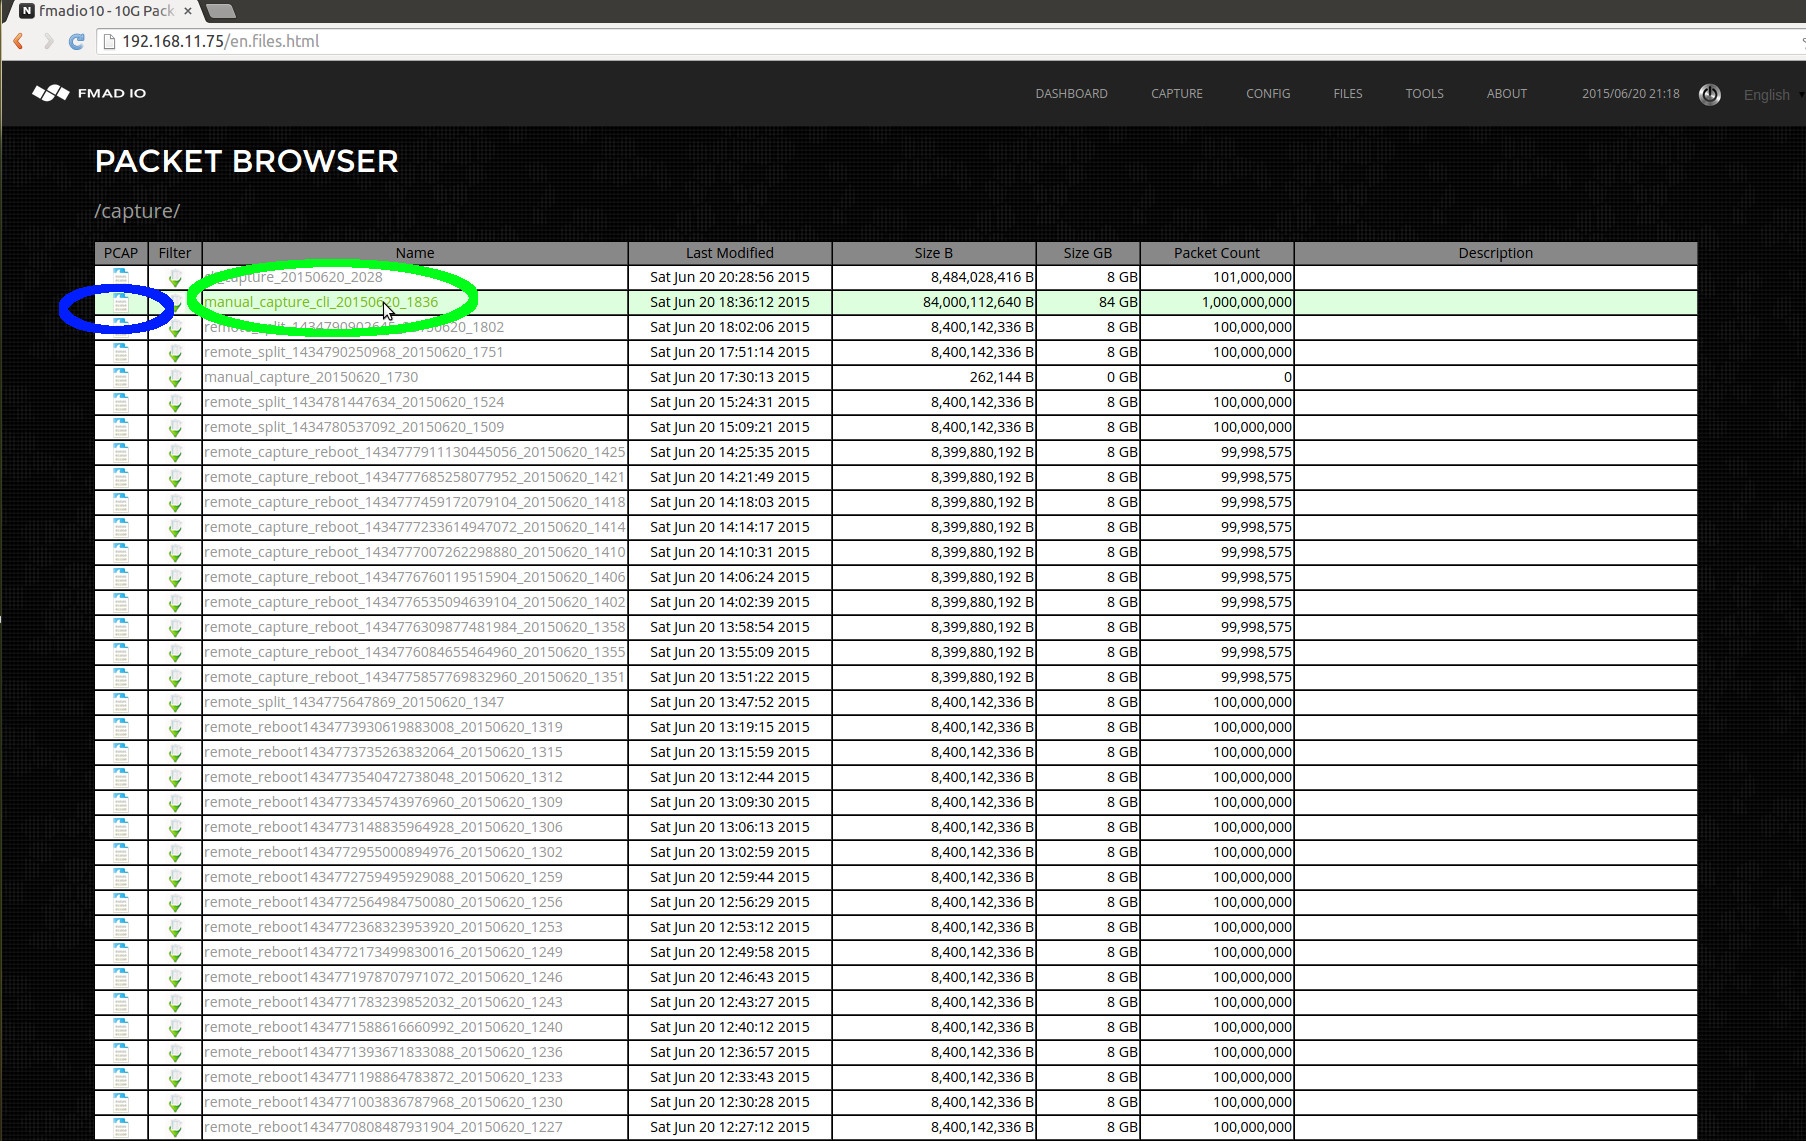
When clicking on the link highlighted in green above, the system displays all splits and views of the capture(shown in the image below). As all views of the capture are displayed, it enables you to select the most appropriate view for the task at hand. In this case we will select 1 second split as highlighted in green below.
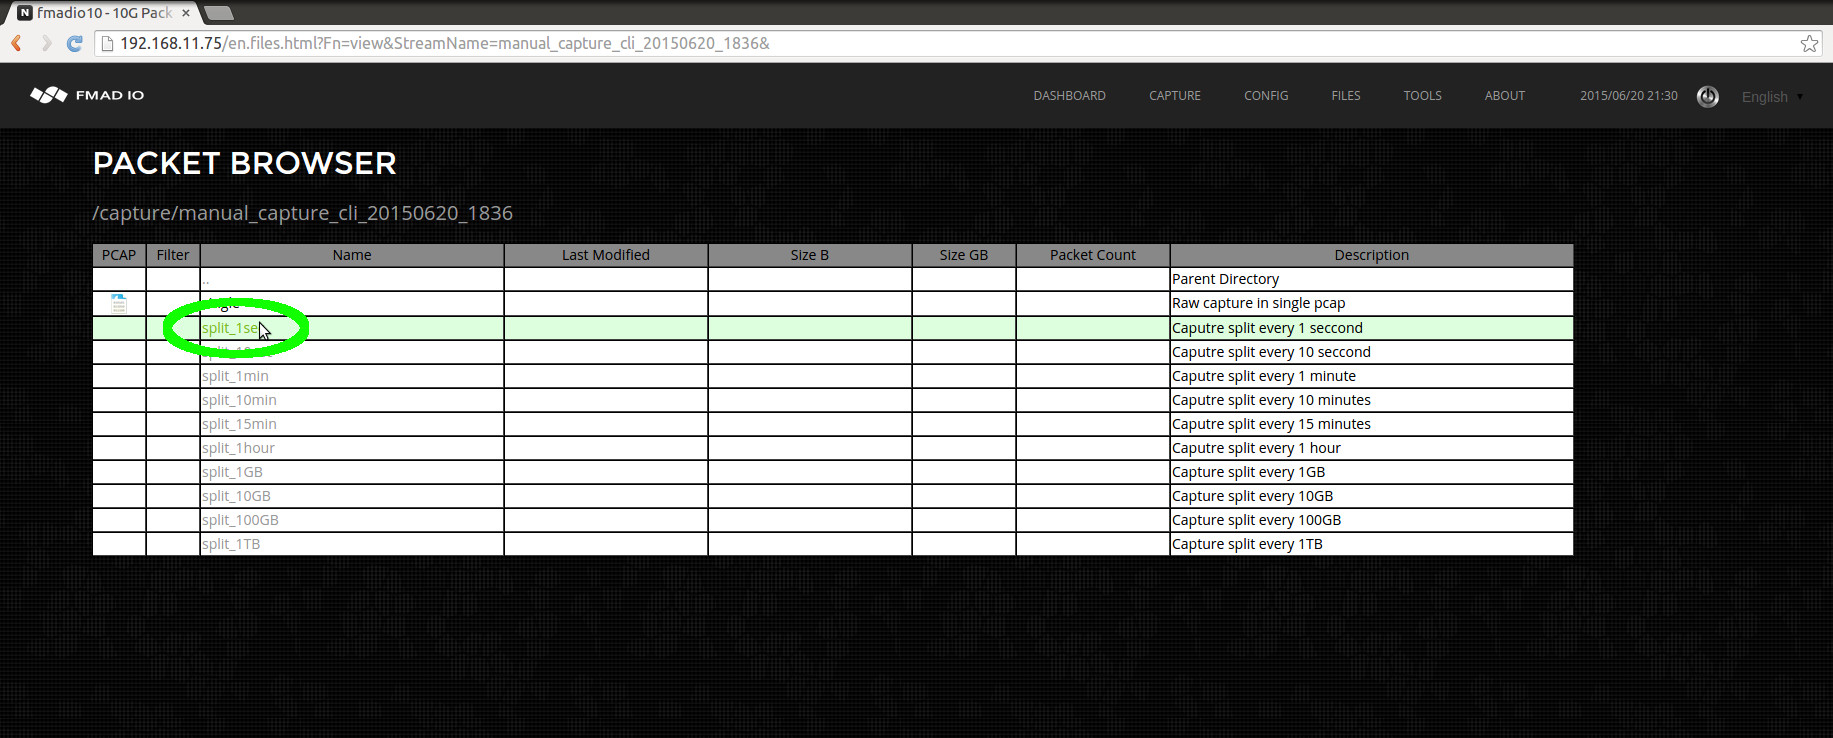
After clicking on the 1 second view from the above image, the full list of per second splits is seen in the screenshot below.
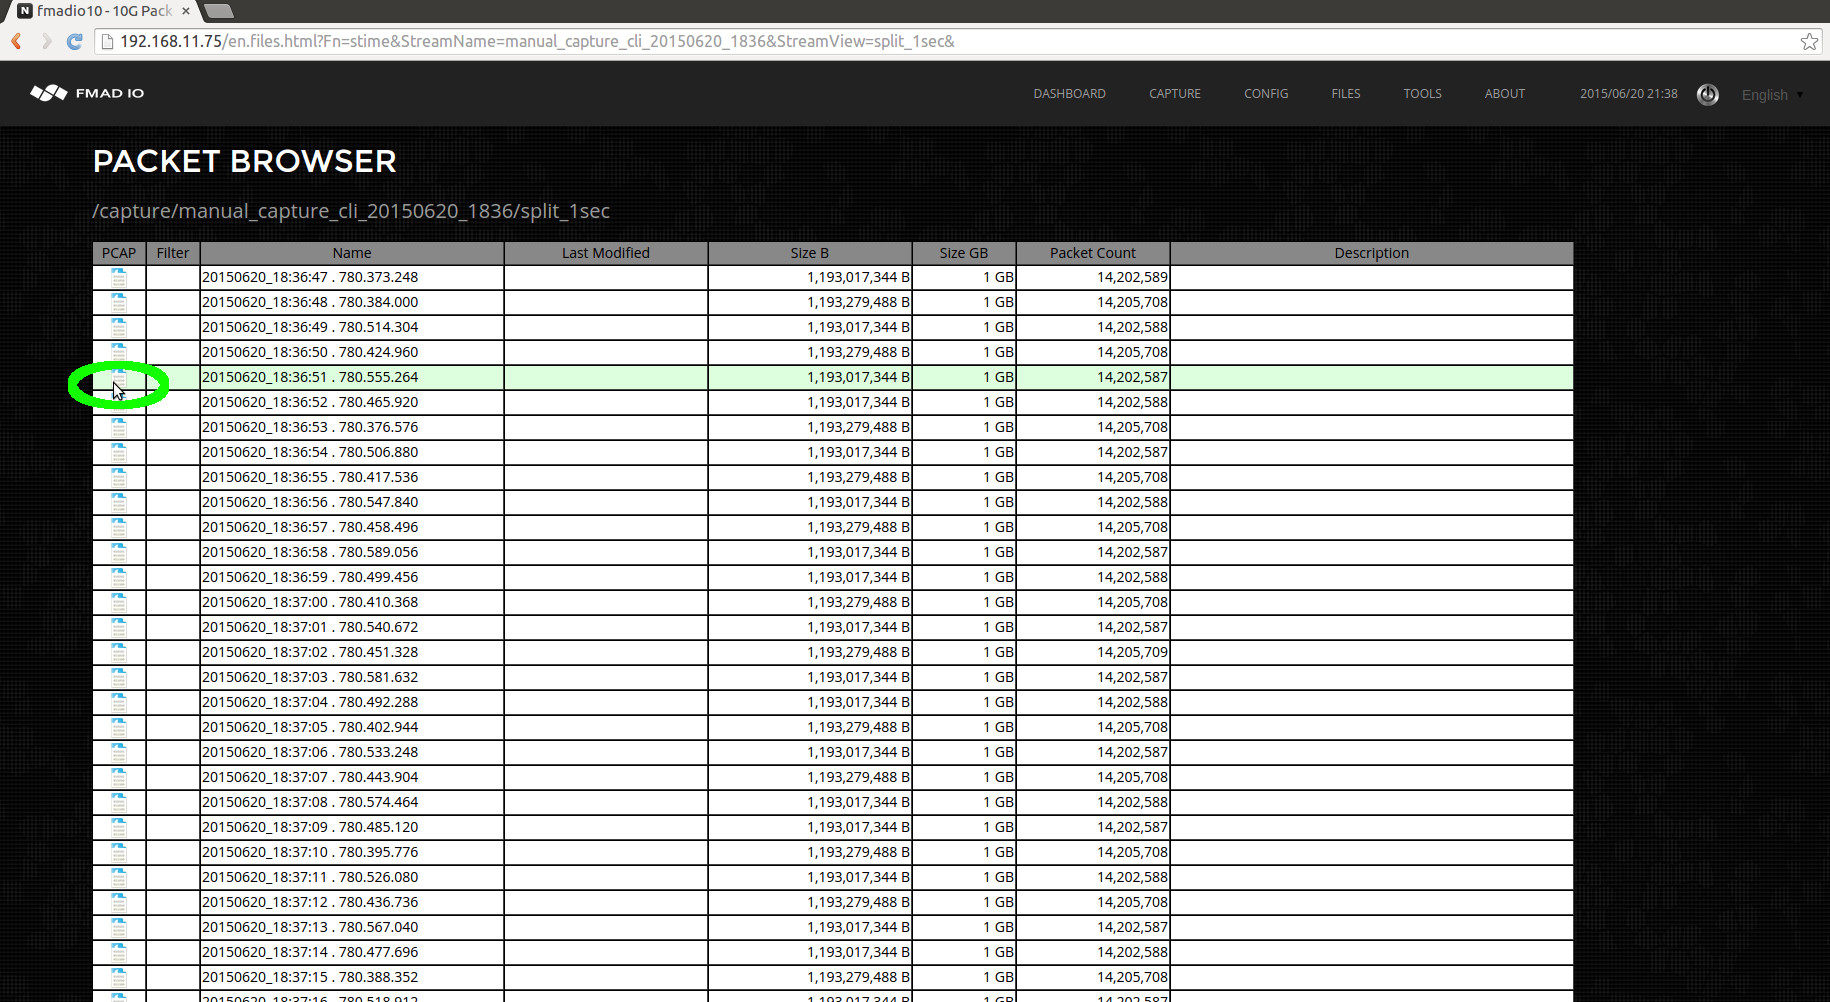
Clicking on the PCAP icon (highlighted in green above) starts a download of the file to local disk. After the download has completed, the file can be opened up in Wireshark or any other PCAP processing utility. In the example below Wireshark has loaded the requested file.
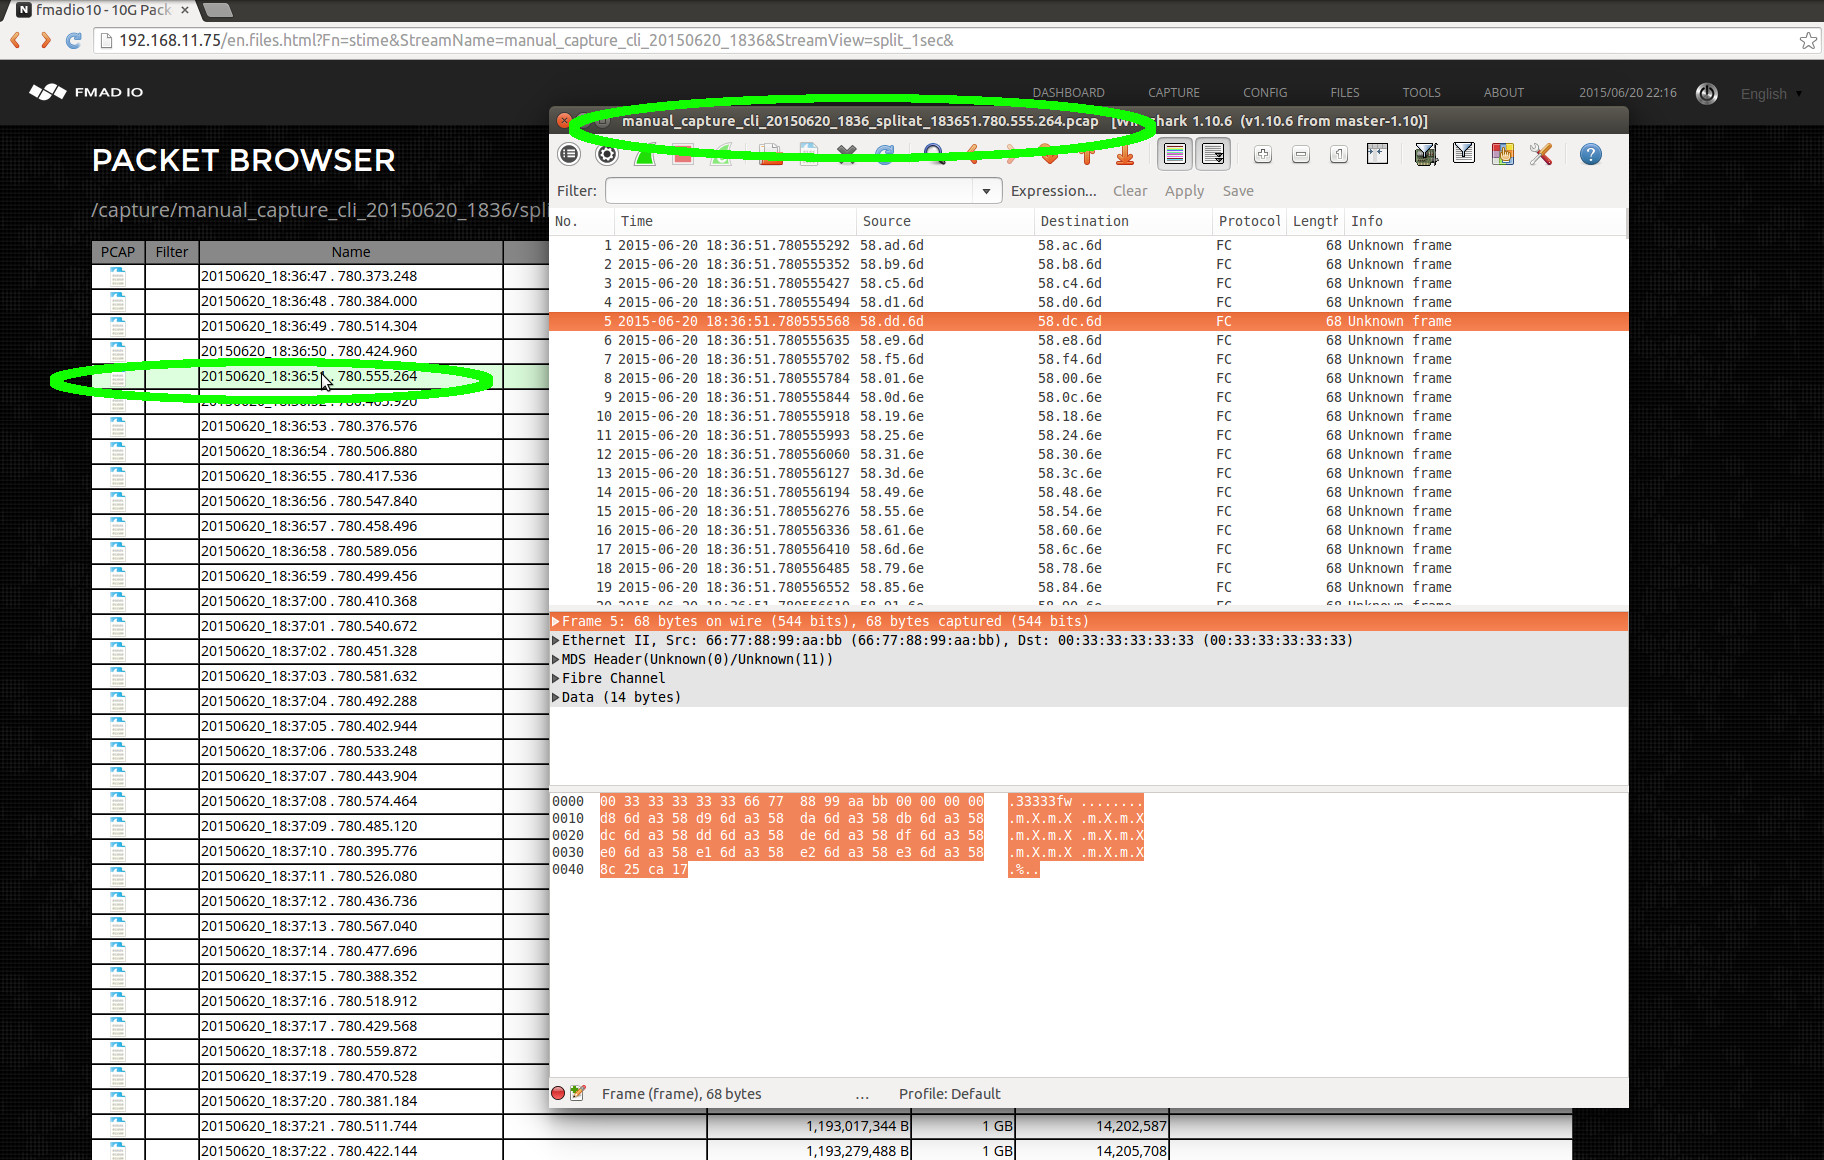
This is a short example of how PCAP files are extracted from the system. See the Advanced section for details on other approaches.
PCAP Download (CLI)
Downloading via a Web interface is intuitive and simple, but is not ideal when integrating with existing scripts and infrastructure. In this section we demonstrate how to use HTTP requests and a simple Command Line Interface (CLI) to find and download the PCAP`s you need.
CLI: Download PCAP
Start by listing all streams on the device in a comma delimited text file using the following URL format
http://192.168.11.75/plain/list
For example.
$ curl -u user:pass "http://192.168.11.75/plain/list"

Filename                                                    , Size Bytes    , Packet Count  , Date                   ,Single PCAP Link,File Link,
cli_capture_20150620_2028                                   ,     8484028416,      101000000, Sat Jun 20 20:28:56 2015,/pcap/single?StreamName=cli_capture_20150620_2028&,/en.files.html?Fn=view&StreamName=cli_capture_20150620_2028&,
manual_capture_cli_20150620_1836                            ,    84000112640,     1000000000, Sat Jun 20 18:36:12 2015,/pcap/single?StreamName=manual_capture_cli_20150620_1836&,/en.files.html?Fn=view&StreamName=manual_capture_cli_20150620_1836&,
remote_split_1434790902645_20150620_1802                    ,     8400142336,      100000000, Sat Jun 20 18:02:06 2015,/pcap/single?StreamName=remote_split_1434790902645_20150620_1802&,/en.files.html?Fn=view&StreamName=remote_split_1434790902645_20150620_1802&,
remote_split_1434790250968_20150620_1751                    ,     8400142336,      100000000, Sat Jun 20 17:51:14 2015,/pcap/single?StreamName=remote_split_1434790250968_20150620_1751&,/en.files.html?Fn=view&StreamName=remote_split_1434790250968_20150620_1751&,
manual_capture_20150620_1730                                ,         262144,              0, Sat Jun 20 17:30:13 2015,/pcap/single?StreamName=manual_capture_20150620_1730&,/en.files.html?Fn=view&StreamName=manual_capture_20150620_1730&,
remote_split_1434781447634_20150620_1524                    ,     8400142336,      100000000, Sat Jun 20 15:24:31 2015,/pcap/single?StreamName=remote_split_1434781447634_20150620_1524&,/en.files.html?Fn=view&StreamName=remote_split_1434781447634_20150620_1524&,
remote_split_1434780537092_20150620_1509                    ,     8400142336,      100000000, Sat Jun 20 15:09:21 2015,/pcap/single?StreamName=remote_split_1434780537092_20150620_1509&,/en.files.html?Fn=view&StreamName=remote_split_1434780537092_20150620_1509&,
remote_capture_reboot_1434777911130445056_20150620_1425     ,     8399880192,       99998575, Sat Jun 20 14:25:35 2015,/pcap/single?StreamName=remote_capture_reboot_1434777911130445056_20150620_1425&,/en.files.html?Fn=view&StreamName=remote_capture_reboot_1434777911130445056_20150620_1425&,
remote_capture_reboot_1434777685258077952_20150620_1421     ,     8399880192,       99998575, Sat Jun 20 14:21:49 2015,/pcap/single?StreamName=remote_capture_reboot_1434777685258077952_20150620_1421&,/en.files.html?Fn=view&StreamName=remote_capture_reboot_1434777685258077952_20150620_1421&,
remote_capture_reboot_1434777459172079104_20150620_1418     ,     8399880192,       99998575, Sat Jun 20 14:18:03 2015,/pcap/single?StreamName=remote_capture_reboot_1434777459172079104_20150620_1418&,/en.files.html?Fn=view&StreamName=remote_capture_reboot_1434777459172079104_20150620_1418&,
remote_capture_reboot_1434777233614947072_20150620_1414     ,     8399880192,       99998575, Sat Jun 20 14:14:17 2015,/pcap/single?StreamName=remote_capture_reboot_1434777233614947072_20150620_1414&,/en.files.html?Fn=view&StreamName=remote_capture_reboot_1434777233614947072_20150620_1414&,
remote_capture_reboot_1434777007262298880_20150620_1410     ,     8399880192,       99998575, Sat Jun 20 14:10:31 2015,/pcap/single?StreamName=remote_capture_reboot_1434777007262298880_20150620_1410&,/en.files.html?Fn=view&StreamName=remote_capture_reboot_1434777007262298880_20150620_1410&,
remote_capture_reboot_1434776760119515904_20150620_1406     ,     8399880192,       99998575, Sat Jun 20 14:06:24 2015,/pcap/single?StreamName=remote_capture_reboot_1434776760119515904_20150620_1406&,/en.files.html?Fn=view&StreamName=remote_capture_reboot_1434776760119515904_20150620_1406&,
remote_capture_reboot_1434776535094639104_20150620_1402     ,     8399880192,       99998575, Sat Jun 20 14:02:39 2015,/pcap/single?StreamName=remote_capture_reboot_1434776535094639104_20150620_1402&,/en.files.html?Fn=view&StreamName=remote_capture_reboot_1434776535094639104_20150620_1402&,
remote_capture_reboot_1434776309877481984_20150620_1358     ,     8399880192,       99998575, Sat Jun 20 13:58:54 2015,/pcap/single?StreamName=remote_capture_reboot_1434776309877481984_20150620_1358&,/en.files.html?Fn=view&StreamName=remote_capture_reboot_1434776309877481984_20150620_1358&,
remote_capture_reboot_1434776084655464960_20150620_1355     ,     8399880192,       99998575, Sat Jun 20 13:55:09 2015,/pcap/single?StreamName=remote_capture_reboot_1434776084655464960_20150620_1355&,/en.files.html?Fn=view&StreamName=remote_capture_reboot_1434776084655464960_20150620_1355&,
remote_capture_reboot_1434775857769832960_20150620_1351     ,     8399880192,       99998575, Sat Jun 20 13:51:22 2015,/pcap/single?StreamName=remote_capture_reboot_1434775857769832960_20150620_1351&,/en.files.html?Fn=view&StreamName=remote_capture_reboot_1434775857769832960_20150620_1351&,
remote_split_1434775647869_20150620_1347                    ,     8400142336,      100000000, Sat Jun 20 13:47:52 2015,/pcap/single?StreamName=remote_split_1434775647869_20150620_1347&,/en.files.html?Fn=view&StreamName=remote_split_1434775647869_20150620_1347&,
remote_reboot1434773930619883008_20150620_1319              ,     8400142336,      100000000, Sat Jun 20 13:19:15 2015,/pcap/single?StreamName=remote_reboot1434773930619883008_20150620_1319&,/en.files.html?Fn=view&StreamName=remote_reboot1434773930619883008_20150620_1319&,
remote_reboot1434773735263832064_20150620_1315              ,     8400142336,      100000000, Sat Jun 20 13:15:59 2015,/pcap/single?StreamName=remote_reboot1434773735263832064_20150620_1315&,/en.files.html?Fn=view&StreamName=remote_reboot1434773735263832064_20150620_1315&,
remote_reboot1434773540472738048_20150620_1312              ,     8400142336,      100000000, Sat Jun 20 13:12:44 2015,/pcap/single?StreamName=remote_reboot1434773540472738048_20150620_1312&,/en.files.html?Fn=view&StreamName=remote_reboot1434773540472738048_20150620_1312&,
remote_reboot1434773345743976960_20150620_1309              ,     8400142336,      100000000, Sat Jun 20 13:09:30 2015,/pcap/single?StreamName=remote_reboot1434773345743976960_20150620_1309&,/en.files.html?Fn=view&StreamName=remote_reboot1434773345743976960_20150620_1309&,
remote_reboot1434773148835964928_20150620_1306              ,     8400142336,      100000000, Sat Jun 20 13:06:13 2015,/pcap/single?StreamName=remote_reboot1434773148835964928_20150620_1306&,/en.files.html?Fn=view&StreamName=remote_reboot1434773148835964928_20150620_1306&,
remote_reboot1434772955000894976_20150620_1302              ,     8400142336,      100000000, Sat Jun 20 13:02:59 2015,/pcap/single?StreamName=remote_reboot1434772955000894976_20150620_1302&,/en.files.html?Fn=view&StreamName=remote_reboot1434772955000894976_20150620_1302&,
remote_reboot1434772759495929088_20150620_1259              ,     8400142336,      100000000, Sat Jun 20 12:59:44 2015,/pcap/single?StreamName=remote_reboot1434772759495929088_20150620_1259&,/en.files.html?Fn=view&StreamName=remote_reboot1434772759495929088_20150620_1259&,
remote_reboot1434772564984750080_20150620_1256              ,     8400142336,      100000000, Sat Jun 20 12:56:29 2015,/pcap/single?StreamName=remote_reboot1434772564984750080_20150620_1256&,/en.files.html?Fn=view&StreamName=remote_reboot1434772564984750080_20150620_1256&,
remote_reboot1434772368323953920_20150620_1253              ,     8400142336,      100000000, Sat Jun 20 12:53:12 2015,/pcap/single?StreamName=remote_reboot1434772368323953920_20150620_1253&,/en.files.html?Fn=view&StreamName=remote_reboot1434772368323953920_20150620_1253&,
remote_reboot1434772173499830016_20150620_1249              ,     8400142336,      100000000, Sat Jun 20 12:49:58 2015,/pcap/single?StreamName=remote_reboot1434772173499830016_20150620_1249&,/en.files.html?Fn=view&StreamName=remote_reboot1434772173499830016_20150620_1249&,
remote_reboot1434771978707971072_20150620_1246              ,     8400142336,      100000000, Sat Jun 20 12:46:43 2015,/pcap/single?StreamName=remote_reboot1434771978707971072_20150620_1246&,/en.files.html?Fn=view&StreamName=remote_reboot1434771978707971072_20150620_1246&,
Above is the example output that's clear and simple to parse. In this case we will select the stream "manual_capture_cli_20150620_1836" to download as a single file.
CLI: PCAP Download Single File
To download the capture "manual_capture_cli_20150620_1836" as a single PCAP use the following URL format
curl -u user:pass http://192.168.11.75/pcap/single?StreamName=InsertName > /capture/todays.pcap
For example to download the capture "manual_capture_cli_20150620_1836" in its entirety.
$ curl -u user:pass "http://192.168.11.75/pcap/single?StreamName=manual_capture_cli_20150620_1836" > /capture/todays.pcap

  % Total    % Received % Xferd  Average Speed   Time    Time     Time  Current
                                 Dload  Upload   Total   Spent    Left  Speed
 60 78.2G   60 47.3G    0     0  1010M      0  0:01:19  0:00:47  0:00:32 1024M

$
Notice the excellent download speed, that approaches the full 10Gbit management port capacity.
CLI: PCAP Split Download
To view all the split options for a capture use the following URL pattern
curl -u user:pass http://192.168.11.75/plain/view?StreamName=InsertName
For example the following request below shows all split options for the capture named "manual_capture_cli_20150620_1836"
$ curl -u user:pass "http://192.168.11.75/plain/view?StreamName=manual_capture_cli_20150620_1836"
SplitMode                     , Link
split_1sec                    , /plain/split?StreamName=manual_capture_cli_20150620_1836&StreamView=split_1sec
split_10sec                   , /plain/split?StreamName=manual_capture_cli_20150620_1836&StreamView=split_10sec
split_1min                    , /plain/split?StreamName=manual_capture_cli_20150620_1836&StreamView=split_1min
split_10min                   , /plain/split?StreamName=manual_capture_cli_20150620_1836&StreamView=split_10min
split_15min                   , /plain/split?StreamName=manual_capture_cli_20150620_1836&StreamView=split_15min
split_1hour                   , /plain/split?StreamName=manual_capture_cli_20150620_1836&StreamView=split_1hour
split_1GB                     , /plain/split?StreamName=manual_capture_cli_20150620_1836&StreamView=split_1GB
split_10GB                    , /plain/split?StreamName=manual_capture_cli_20150620_1836&StreamView=split_10GB
split_100GB                   , /plain/split?StreamName=manual_capture_cli_20150620_1836&StreamView=split_100GB
split_1TB                     , /plain/split?StreamName=manual_capture_cli_20150620_1836&StreamView=split_1TB
Where the first column is the split operation, and the second column is the URL to list the split files.
After deciding on the split mode, the following URL pattern is used to list all files.
curl -u user:pass http://192.168.11.75/plain/split?StreamName=InsertName&StreamView=InsertView
For example, extracting a list of 1 second splits from the capture named "manual_capture_cli_20150620_1836"
$ curl -u user:pass "http://192.168.11.75/plain/split?StreamName=manual_capture_cli_20150620_1836&StreamView=split_1sec"
Name                          ,     Size Bytes, Packet Count, URL
20150620_18:36:47.780.373.248 ,     1193017344,     14202589, /pcap/splittime?StreamName=manual_capture_cli_20150620_1836&Start=1434793007780373366ULL&Stop=1434793008780383914ULL
20150620_18:36:48.780.384.000 ,     1193279488,     14205708, /pcap/splittime?StreamName=manual_capture_cli_20150620_1836&Start=1434793008780383914ULL&Stop=1434793009780514262ULL
20150620_18:36:49.780.514.304 ,     1193017344,     14202588, /pcap/splittime?StreamName=manual_capture_cli_20150620_1836&Start=1434793009780514262ULL&Stop=1434793010780424945ULL
20150620_18:36:50.780.424.960 ,     1193279488,     14205708, /pcap/splittime?StreamName=manual_capture_cli_20150620_1836&Start=1434793010780424945ULL&Stop=1434793011780555292ULL
20150620_18:36:51.780.555.264 ,     1193017344,     14202587, /pcap/splittime?StreamName=manual_capture_cli_20150620_1836&Start=1434793011780555292ULL&Stop=1434793012780465900ULL
20150620_18:36:52.780.465.920 ,     1193017344,     14202588, /pcap/splittime?StreamName=manual_capture_cli_20150620_1836&Start=1434793012780465900ULL&Stop=1434793013780376583ULL
20150620_18:36:53.780.376.576 ,     1193279488,     14205708, /pcap/splittime?StreamName=manual_capture_cli_20150620_1836&Start=1434793013780376583ULL&Stop=1434793014780506931ULL
20150620_18:36:54.780.506.880 ,     1193017344,     14202587, /pcap/splittime?StreamName=manual_capture_cli_20150620_1836&Start=1434793014780506931ULL&Stop=1434793015780417554ULL
20150620_18:36:55.780.417.536 ,     1193279488,     14205708, /pcap/splittime?StreamName=manual_capture_cli_20150620_1836&Start=1434793015780417554ULL&Stop=1434793016780547901ULL
20150620_18:36:56.780.547.840 ,     1193017344,     14202588, /pcap/splittime?StreamName=manual_capture_cli_20150620_1836&Start=1434793016780547901ULL&Stop=1434793017780458591ULL
20150620_18:36:57.780.458.496 ,     1193279488,     14205708, /pcap/splittime?StreamName=manual_capture_cli_20150620_1836&Start=1434793017780458591ULL&Stop=1434793018780588947ULL
20150620_18:36:58.780.589.056 ,     1193017344,     14202587, /pcap/splittime?StreamName=manual_capture_cli_20150620_1836&Start=1434793018780588947ULL&Stop=1434793019780499570ULL
.
.
.
The above shows all split filenames of capture ""manual_capture_cli_20150620_1836" at 1 second split interval. To download a specific split, for example the 1 second capture at "20150620_18:36:58" use the link obtained above and issue the CURL get command shown below. In this example we`re piping the output into tcpdump via stdin.
$ curl -u user:pass "http://192.168.11.75/pcap/splittime?StreamName=manual_capture_cli_20150620_1836&Start=1434793018780588947ULL&Stop=1434793019780499570ULL" | ./tcpdump_ns -r - -nn

  % Total    % Received % Xferd  Average Speed   Time    Time     Time  Current
                                 Dload  Upload   Total   Spent    Left  Speed
100    24    0    24    0     0      2      0 --:--:--  0:00:08 --:--:--     0reading from file -, link-type EN10MB (Ethernet)
18:36:58.780.589.081 66:77:88:99:aa:bb > 00:33:33:33:33:33 Null Information, send seq 76, rcv seq 18, Flags [Command], length 54
18:36:58.780.589.163 66:77:88:99:aa:bb > 00:33:33:33:33:33 Null Information, send seq 82, rcv seq 18, Flags [Command], length 54
18:36:58.780.589.222 66:77:88:99:aa:bb > 00:33:33:33:33:33 Null Information, send seq 88, rcv seq 18, Flags [Command], length 54
18:36:58.780.589.297 66:77:88:99:aa:bb > 00:33:33:33:33:33 Null Information, send seq 94, rcv seq 18, Flags [Command], length 54
18:36:58.780.589.364 66:77:88:99:aa:bb > 00:33:33:33:33:33 Null Information, send seq 100, rcv seq 18, Flags [Command], length 54
18:36:58.780.589.438 66:77:88:99:aa:bb > 00:33:33:33:33:33 Null Information, send seq 106, rcv seq 18, Flags [Command], length 54
18:36:58.780.589.506 66:77:88:99:aa:bb > 00:33:33:33:33:33 Null Information, send seq 112, rcv seq 18, Flags [Command], length 54
18:36:58.780.589.573 66:77:88:99:aa:bb > 00:33:33:33:33:33 Null Information, send seq 118, rcv seq 18, Flags [Command], length 54
18:36:58.780.589.655 66:77:88:99:aa:bb > 00:33:33:33:33:33 Null Information, send seq 124, rcv seq 18, Flags [Command], length 54
Integration with your existing scripts and infrastructure is achieved using simple HTTP/HTTPS requests that are clean and easy to understand.
CLI Download: Summary
Quick summary of CLI download operations:
| Operation | URL |
| List Captures |
http://capture.sys.ip/plain/list
|
| Single file download |
http://capture.sys.ip/pcap/single?StreamName=InsertName
|
| List Capture`s various split`s |
http://capture.sys.ip/plain/view?StreamName=InsertName
|
| List Capture`s specific split file list |
http://capture.sys.ip/plain/split?StreamName=InsertName?StreamView=InsertView
|
Packet Filtering
For post capture analysis, Filter blocks and Filter Expressions enable complex and almost arbitrary filtering capabilities. We separate filtering into simple per packet "Filter Blocks", for example Is the packet UDP? which are combined into more complicated "Filter Expressions". This enables you to chain and build complex filter expressions based on your requirements.
Simple Filter
Starting with a very simple filter, "Extract all TCP packets" we build in the following way.
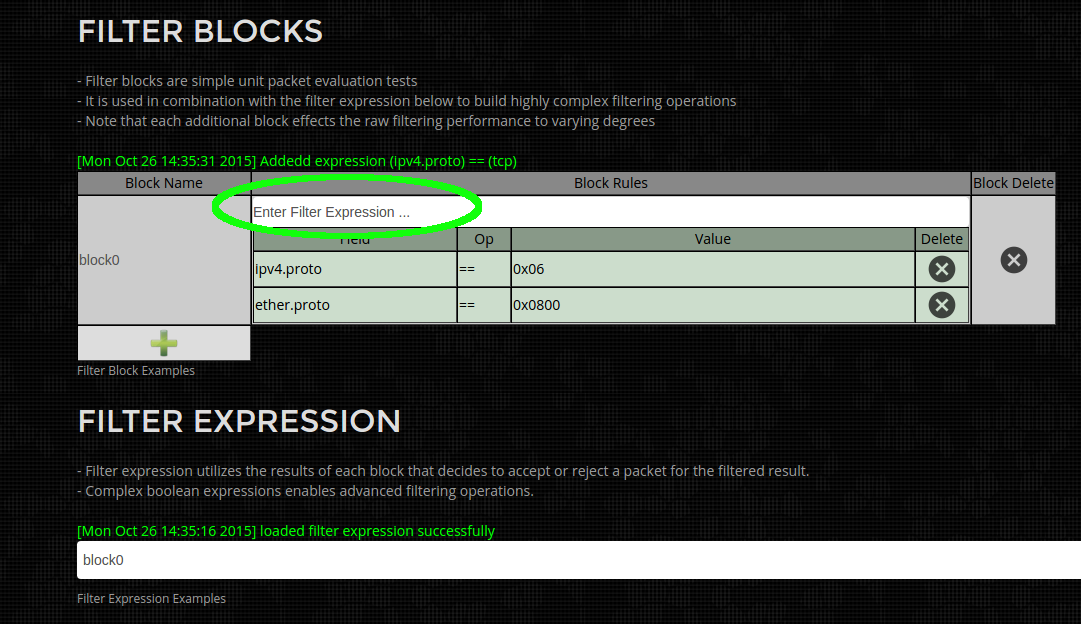
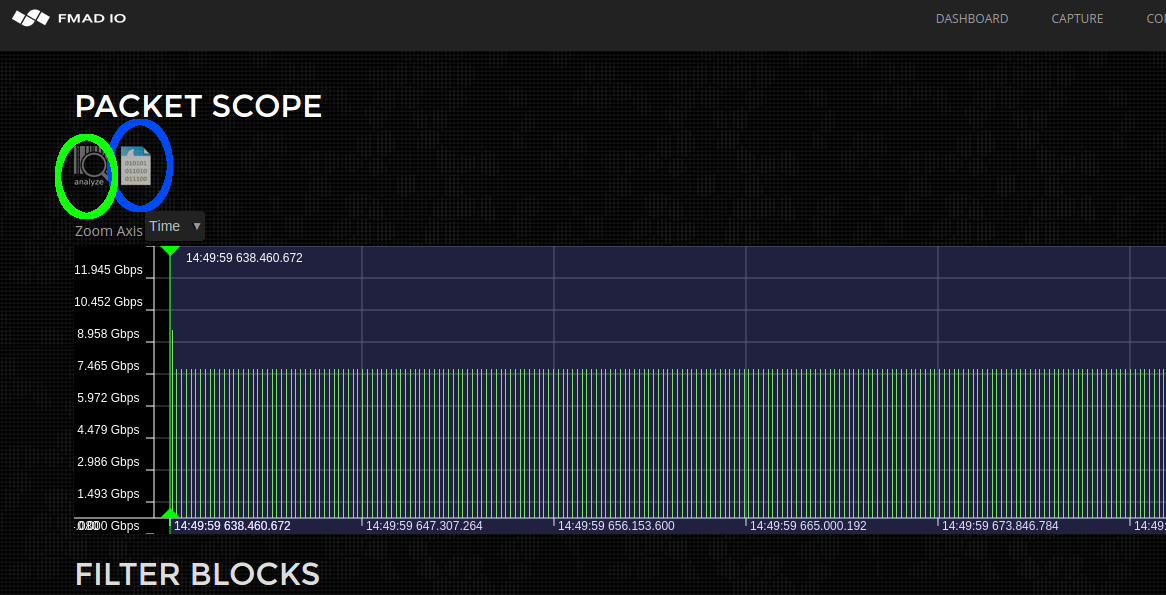
Step 1)
Enter the filter expression "ipv4.proto == tcp" in the filter block highlighted in green below. After pressing enter the display will look like the image below.
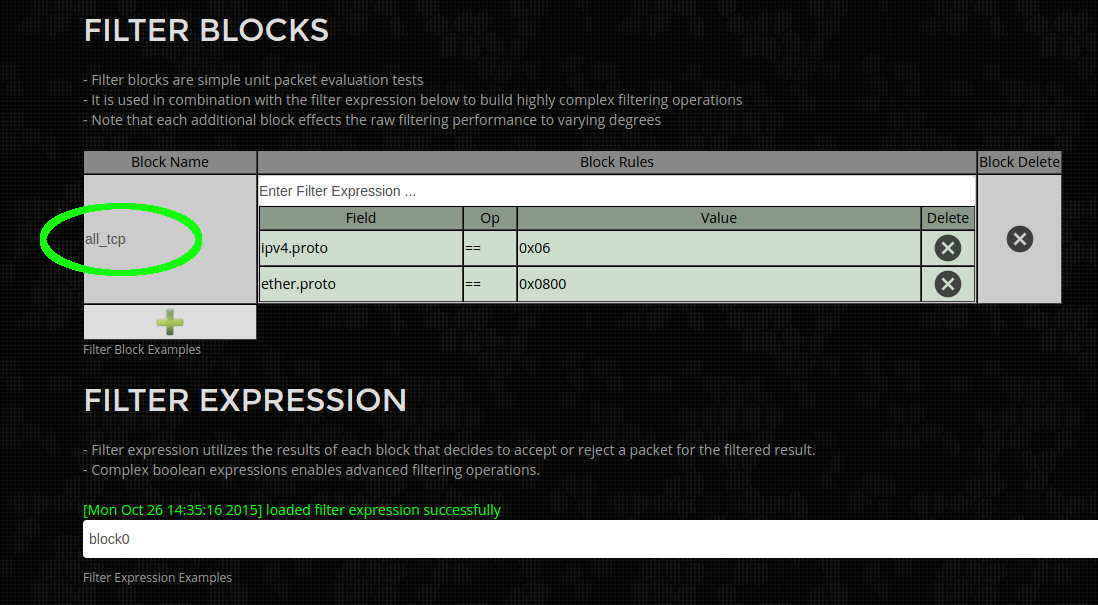
Step 2) Rename the Filter Expression to "all_tcp" by clicking on and editing the text in the area highlighted in green below. This improves readability but for simple filters it is excessive and not required.
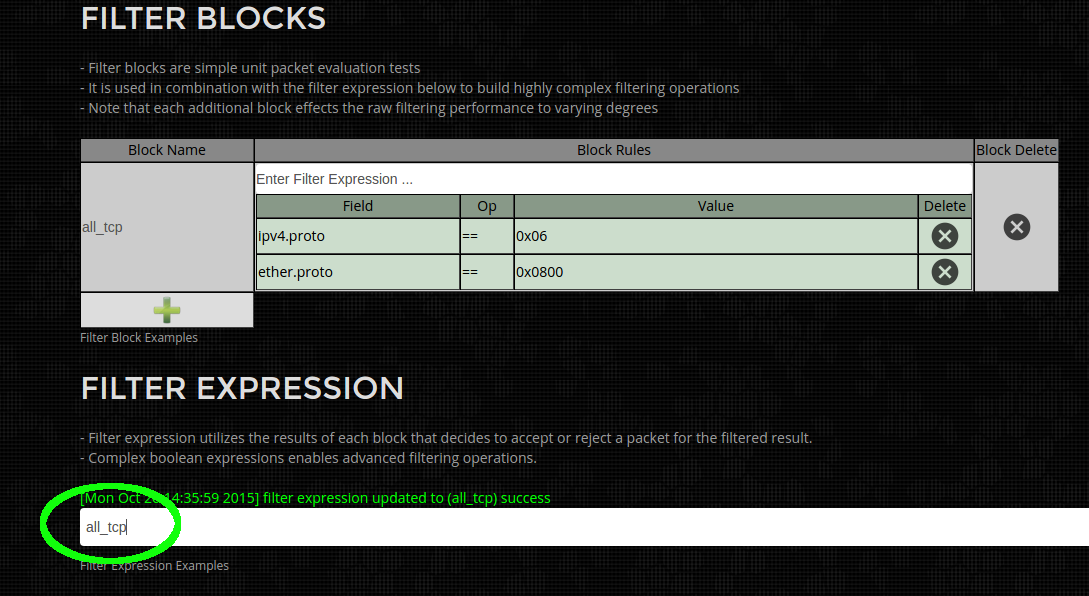
Step 3) Update the filter expression by clicking and editing the area highlighted in green below to reference the newly named "all_tcp" Filter Block. For simple filters the default values of "block0" can be used.
Step 4)
Run packet Analysis or Download to PCAP by selecting on the appropriate icons as shown below. (shown below is green to run analysis, blue to download as PCAP)
Below is a quick list of example filters currently supported. If you require additional filters please let us know.
| ether.proto == ipv4 | select all IPv4 traffic |
| ether.addr == 00:ba:be: | select all ethernet mac address starting with wild card 00:ba:be:*:*:* |
| ether.addr == 00:ba:be:11:22:33 | select all packets with exact mac address (src or dest) of 00:ba:be:11:22:33 |
| ether.addr == 00:* | select all packets with wildcard mac address (src or dest) |
| ether.fcs == fail | select all packets with invalid ethernet frame FCS |
| ipv4.addr == 192.168.1.1 | select all ipv4 packets with address of 192.168.1.1 |
| ipv4.addr == 192.168.1.0/24 | select all ipv4 packets on subnet 192.168.1.0/24 |
| ipv4.addr.src == 192.168.1.0/24 | select all ipv4 packets whose source address is on subnet 192.168.1.0/24 |
| ipv4.proto == tcp | select all ipv4 TCP packets |
| ipv4.proto == udp | select all ipv4 UDP packets |
| ipv4.proto == icmp | select all ipv4 ICMP packets |
| ipv4.proto == igmp | select all ipv4 IGMP packets |
| tcp.port == 1000 | select all tcp traffic with port number 1000 |
| tcp.port == 1000-2000 | select all tcp traffic with port number range from 1000 to 2000 |
| tcp.port.src == 1000 | select all tcp traffic with source port number 1000 |
| udp.port == 3000 | select all udp traffic with port number 3000 |
| udp.port == 3000-4000 | select all udp traffic with port number range from 3000 to 4000 |
| udp.port.src == 3000 | select all udp traffic with source port number 3000 |
| frame.time == 20141225_08:00:00.100.200.300 | select all packets after the date 2014 12(Dec) 25th from 8:00:00.100.200.300 |
| frame.time == 20141225_08:00:00.100.200.300-20141225_17:00:00.400.500.600 | select all packets after the date 2014 12(Dec) 25th from 8:00:00.100.200.300 but before 2014 12(Dec) 25th at 17:00:00.400.500.600 |
| frame.time == 07:00:00 | select all packets after todays date at 07:00:00am |
| frame.size <= 128 | select all packets less than or equal to 128 bytes in length |
| frame.size >= 1024 | select all packets greater than or equal to 1024 bytes in length |
| frame.size == 64 | select all packets equal to 64 bytes in length |
| vlan.id == 1234 | select vlan tag id 1234 |
Complex Filters
Complex filters are possible by combining multiple Filter Blocks using Filter Expressions. The system parses simple boolean logic expression which references Filter blocks specified above.
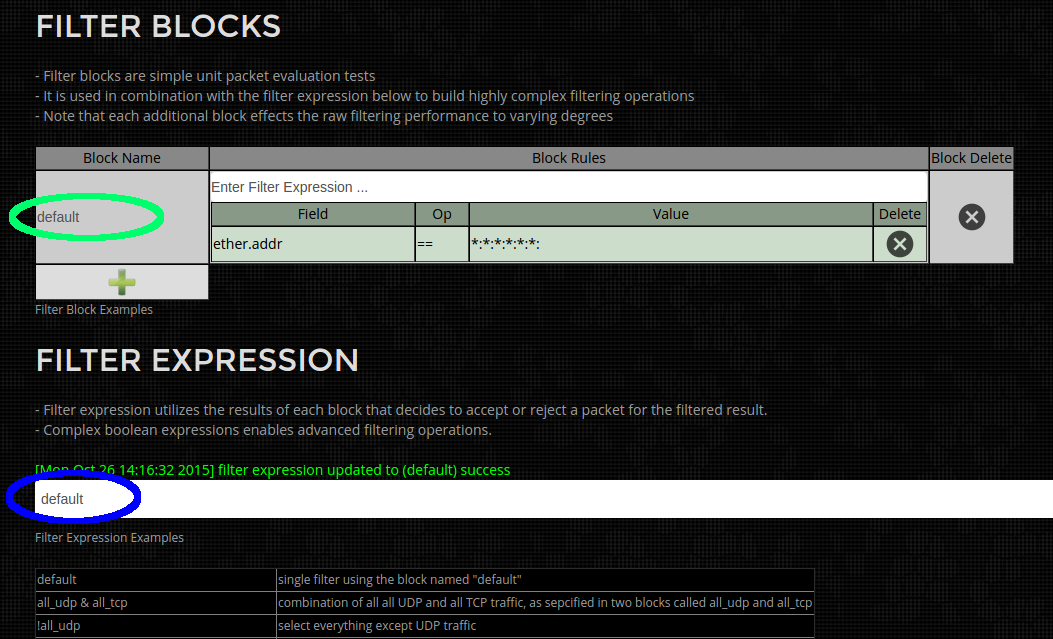
Example Filter (Simple):
Simple One block expression to match all ethernet MAC address(effectively no filtering). Edit the filter Block name (in green below) to "default" and replacing the Filter Expression (in blue below) to "default".
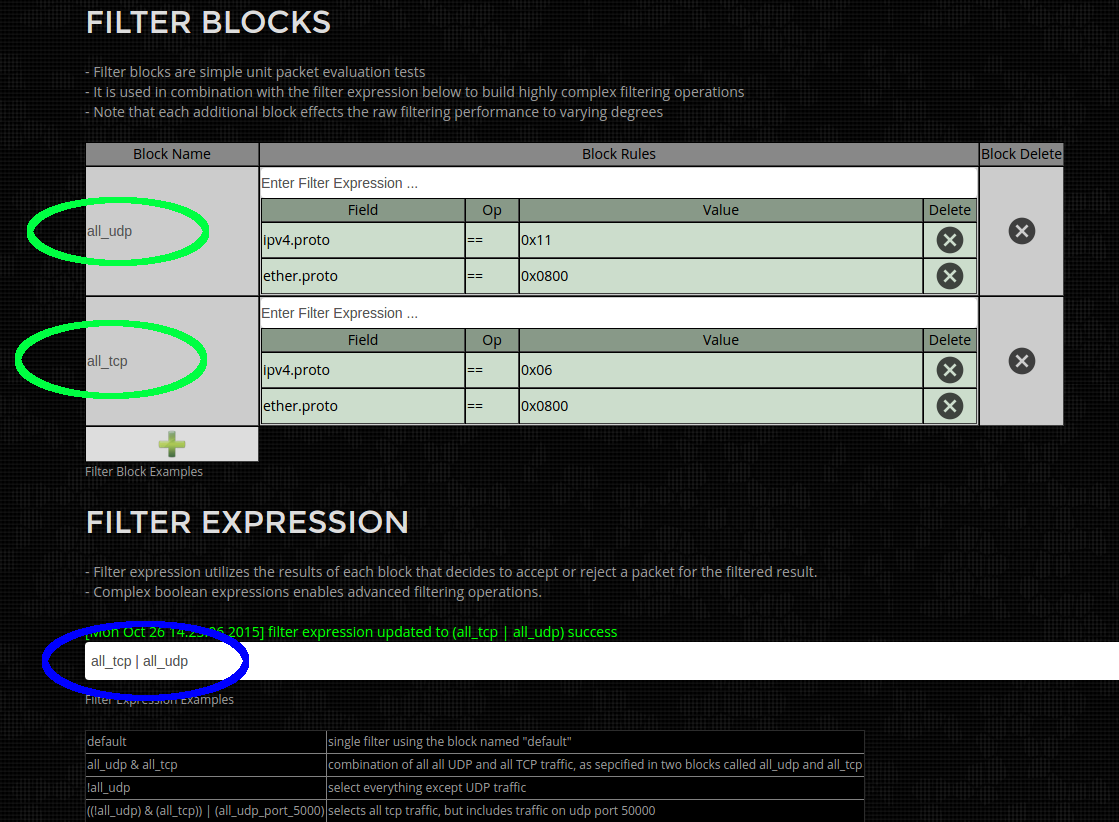
Example Filter (UDP and TCP traffic):
This is a 2 block filter, where the first block "all_udp" (in Green below) selects all UDP packets. The second block "all_tcp" (in green below) selects all TCP packets. And the Filter expression (in blue below) selects "all_udp" packets OR "all_tcp" packets. Net result is filtering for either TCP or UDP packets.
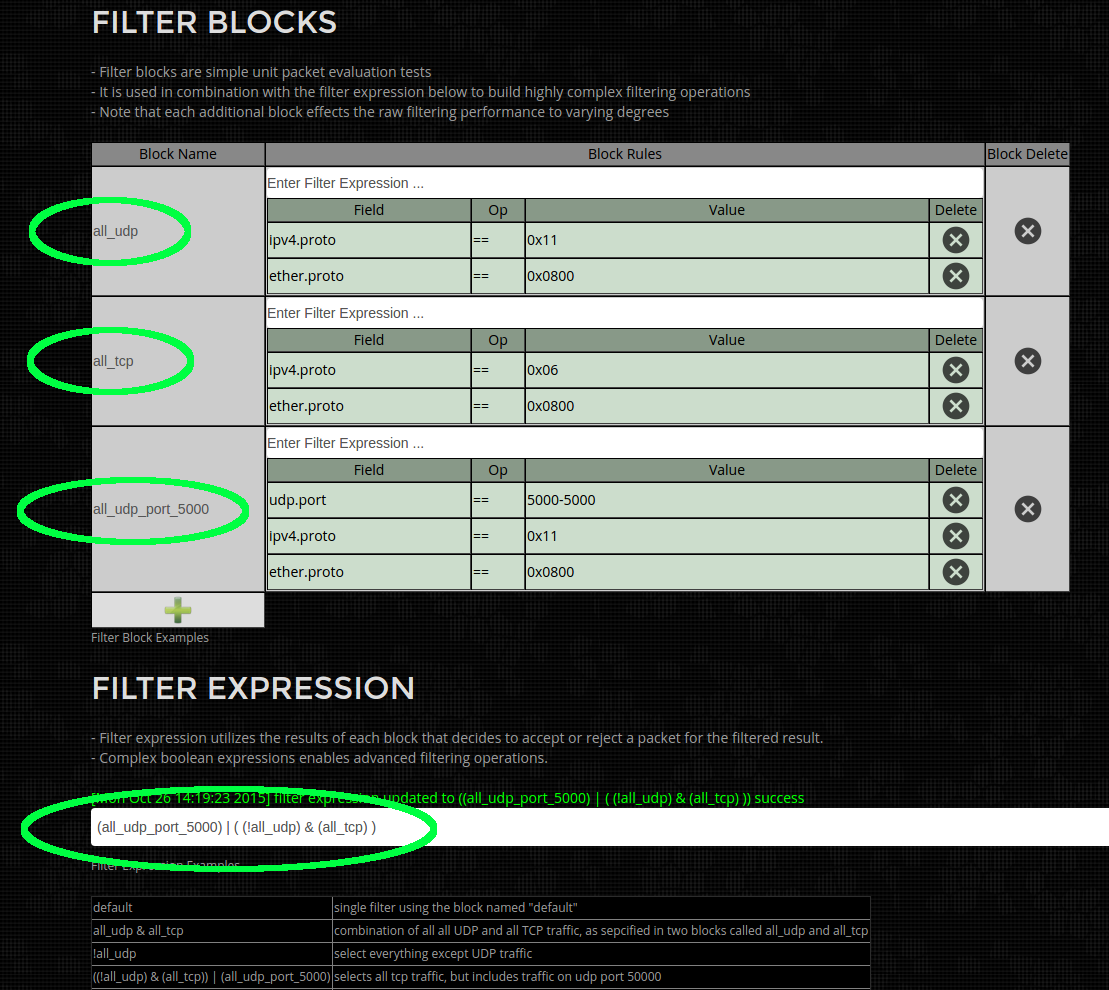
Example Filter (UDP Port 5000 and TCP traffic):
This is a 3 block filter, where the first block "all_udp" (in Green below) selects all UDP packets. The second block "all_tcp" (in green below) selects all TCP packets. And the 3rd block "all_udp_port_5000" selects UDP packets on port 5000.
The Filter expression (in blue below) is some what verbose, as it selects TCP packets (but not UDP) "((!all_udp) & (all_tcp))", technically just all_tcp is sufficient but is expanded for demonstration purposes. OR all UDP packets on port 5000 "all_udp_port_5000". Net result is all TCP and UDP port 5000 packets are selected.
System Log Generation
The first step for any problem resolution is generating detailed log files for analysis to understand the exact nature of the problem. Our system automatically generates logfile information using the following steps.
Step 1)
Select the Tools menu hilighted in green below.
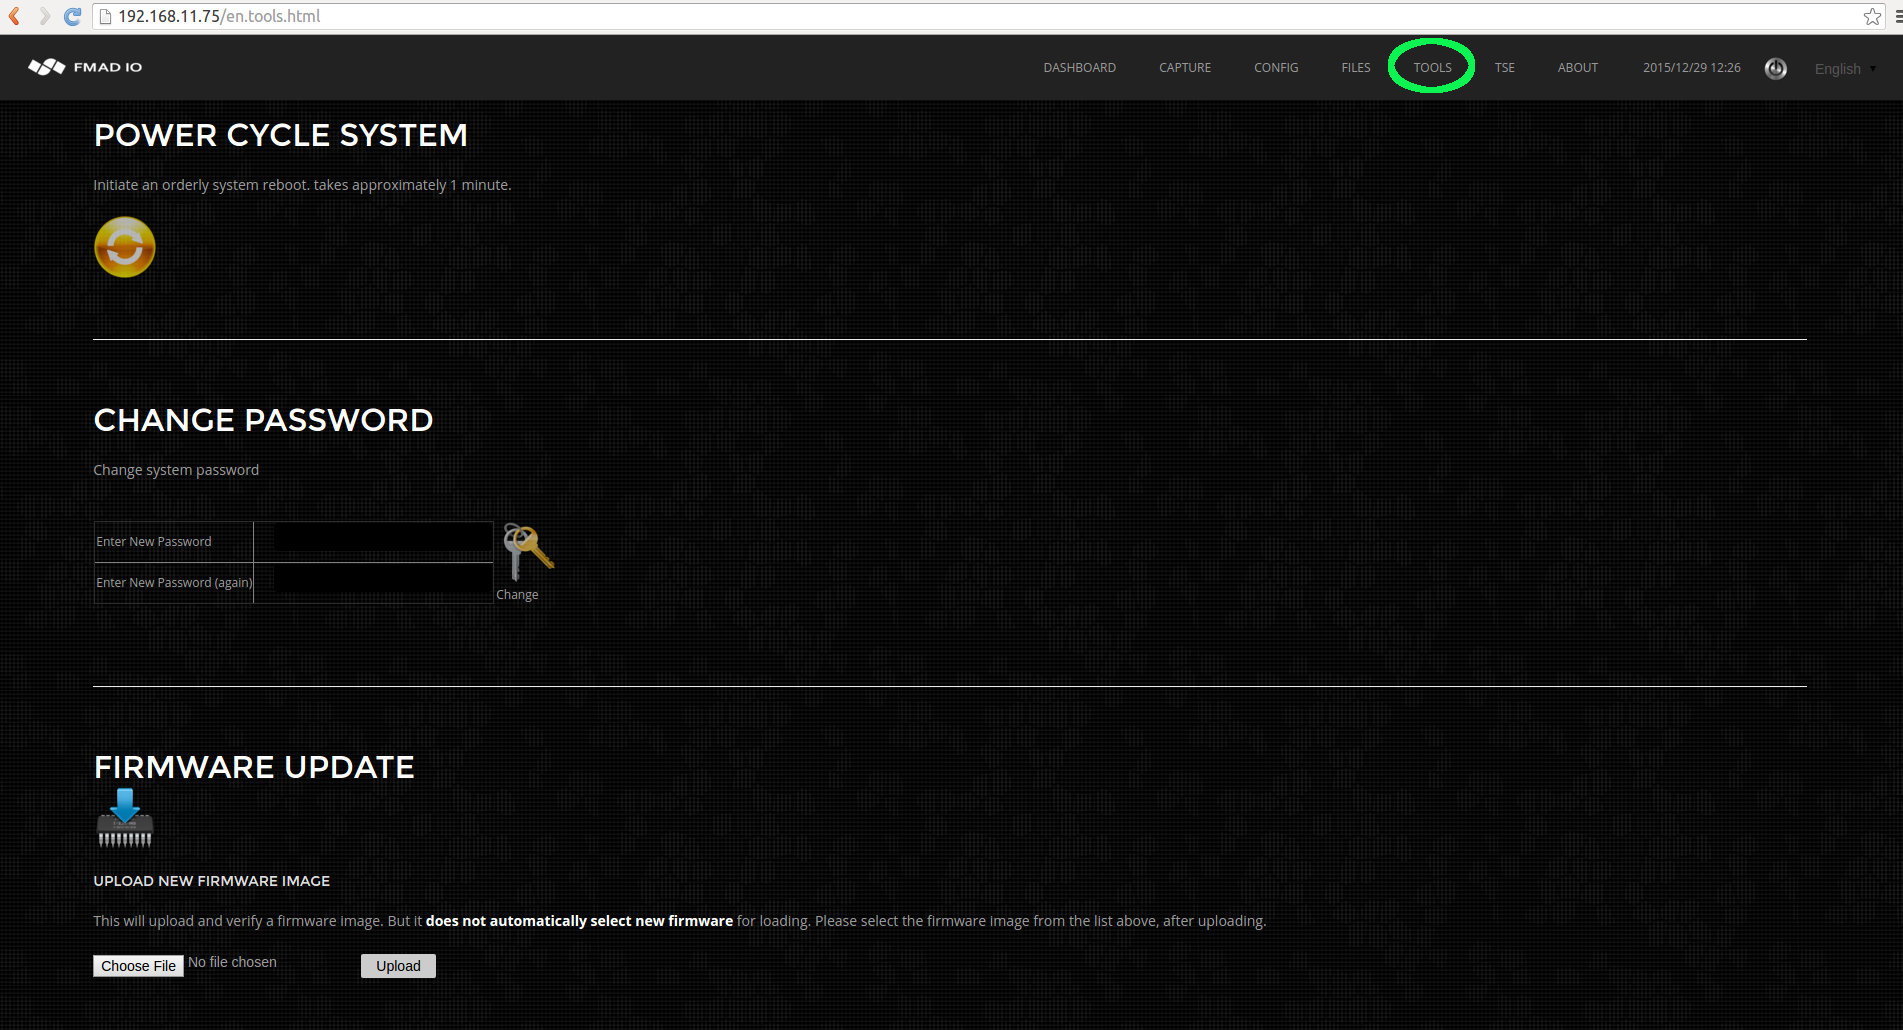
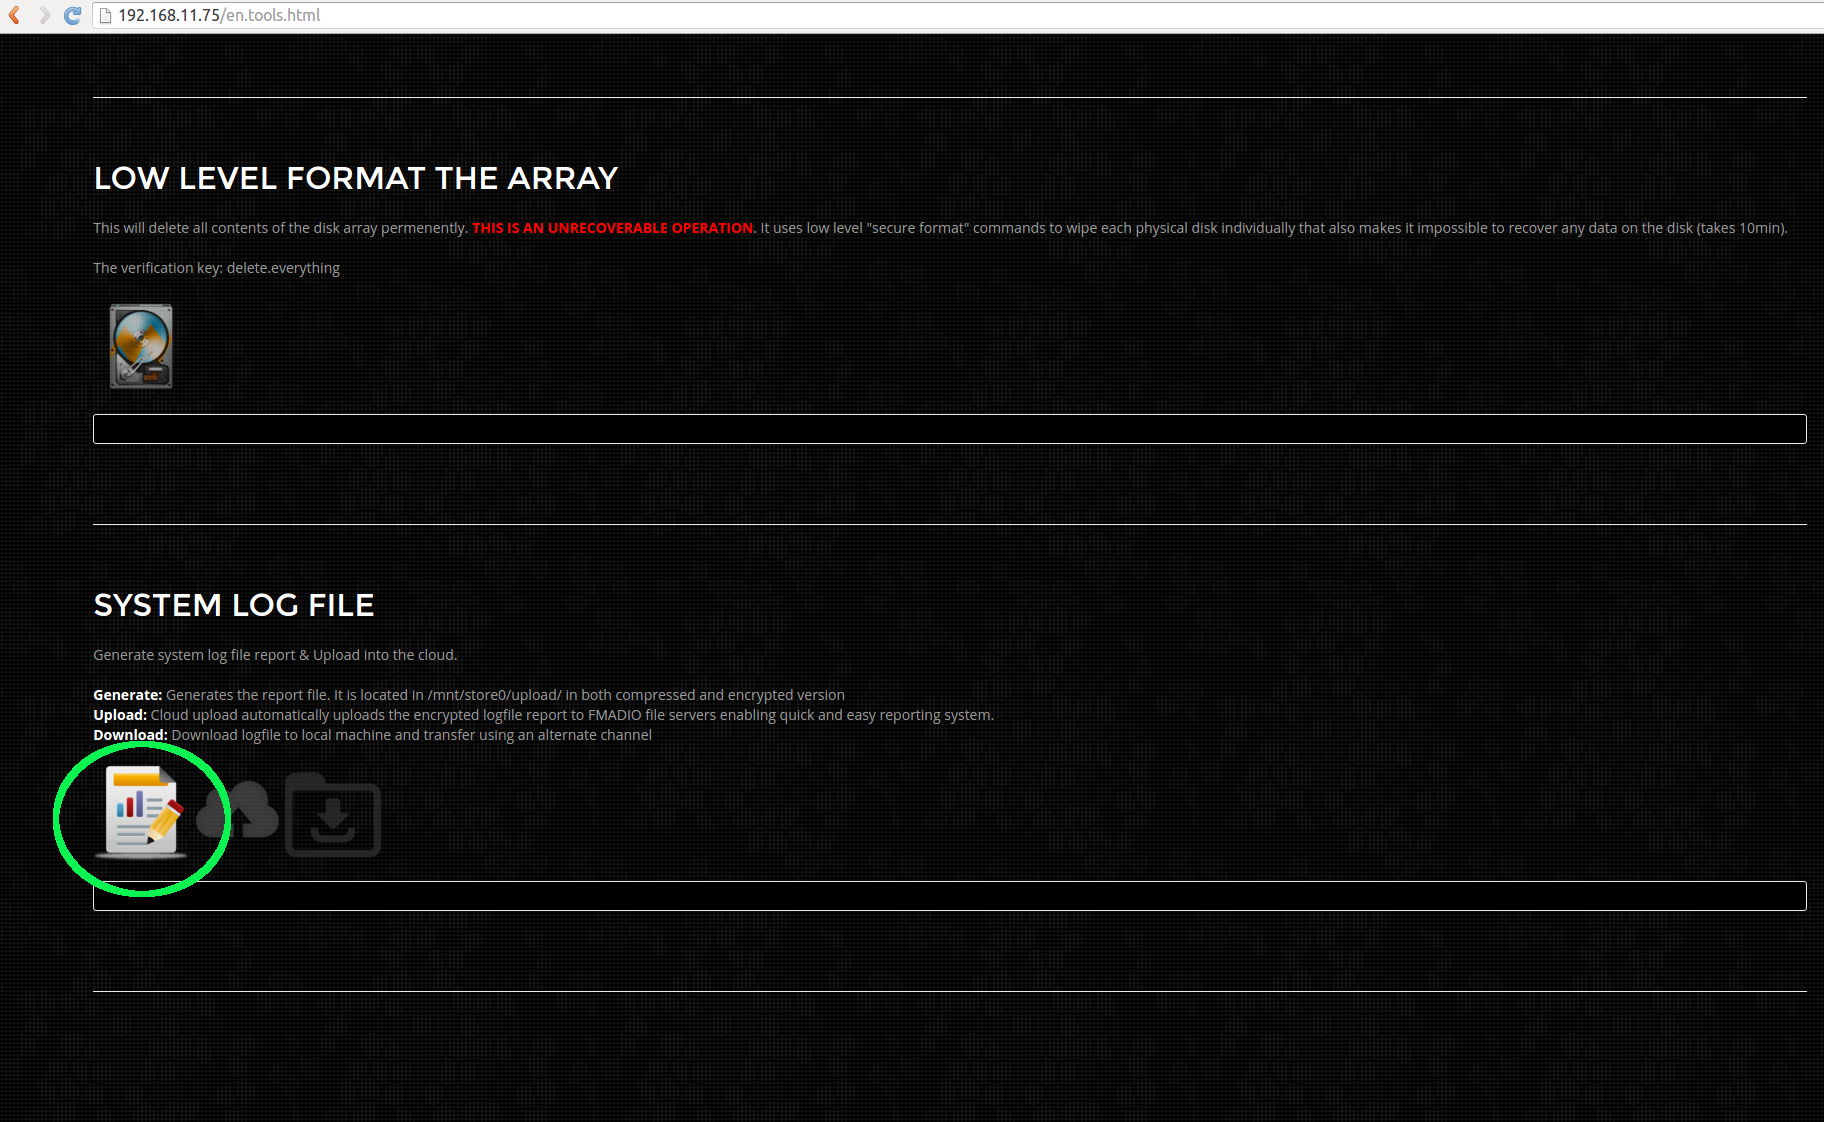
Step 2)
Start System Log generation, by clicking on the icon hilighted in green below.
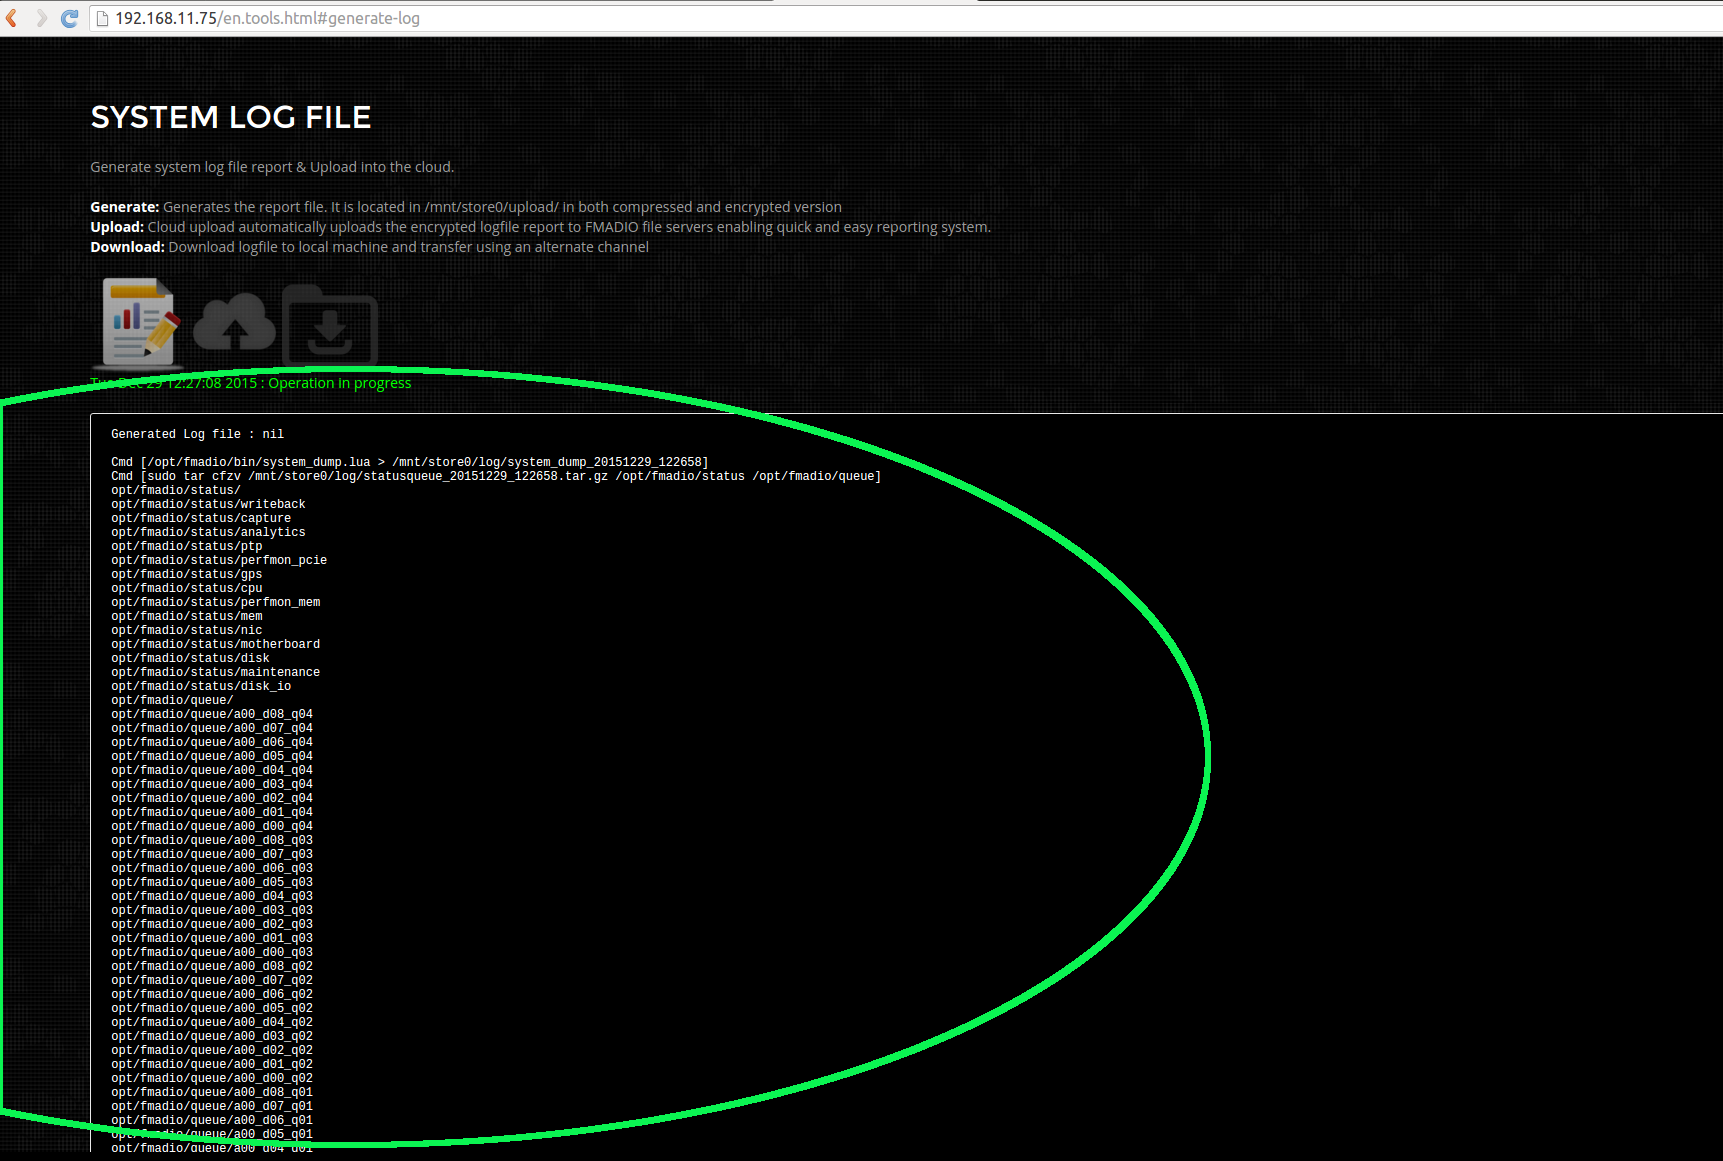
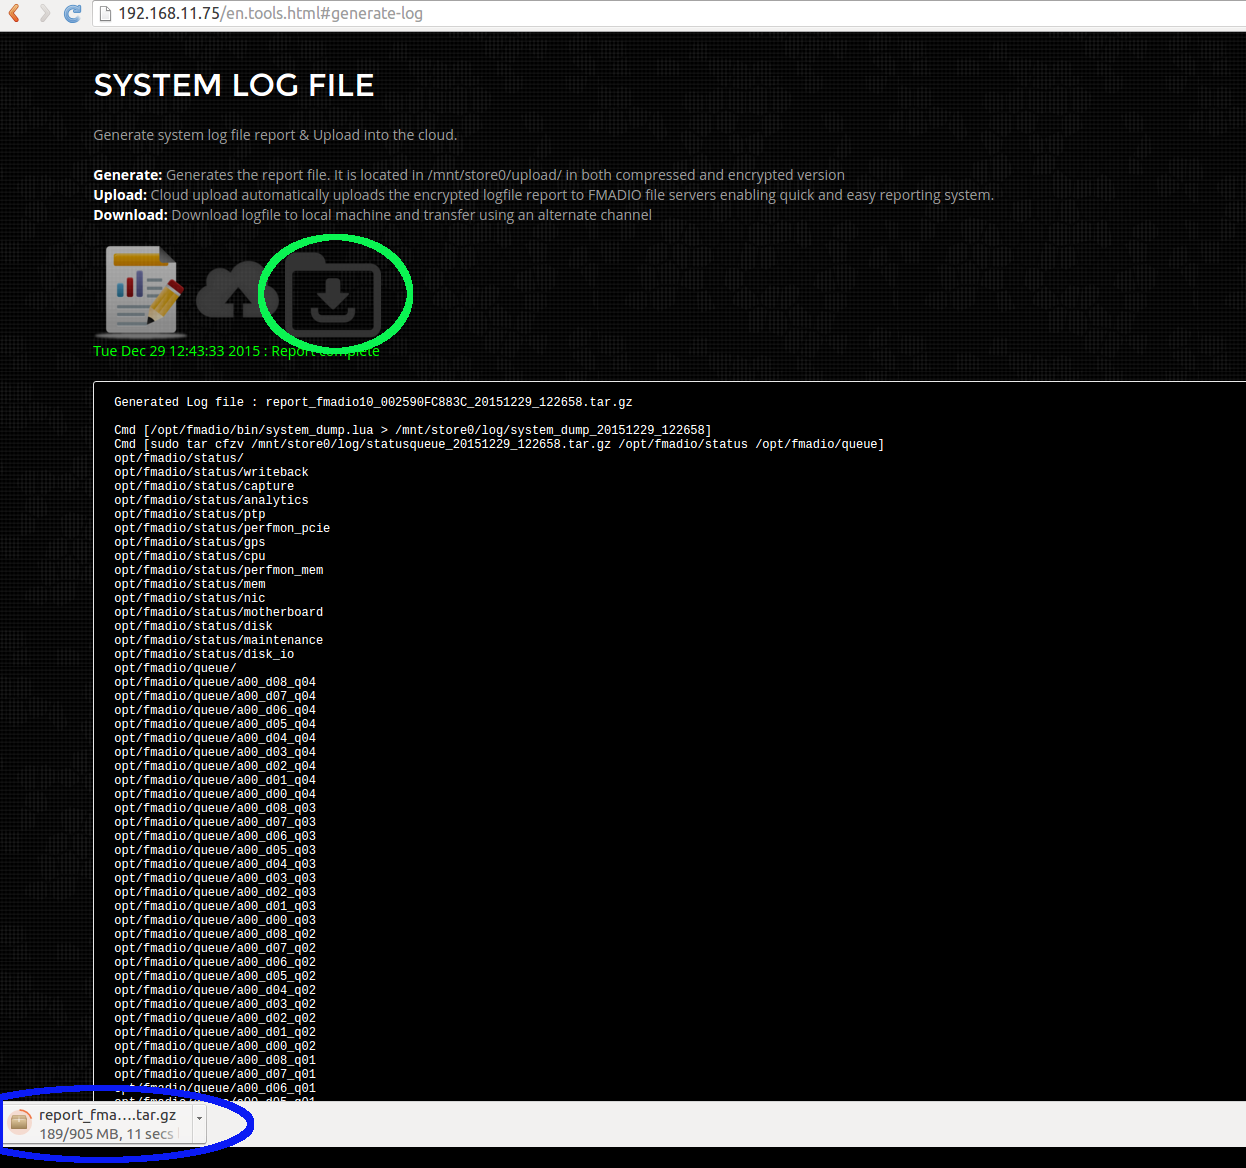
Step 3)
Logfile generation starts with status information shown in area hilighted in green. Depending on the size of logfile this may take from 1 - 15 minutes to complete.
Step 4)
When completed the status will change as hilighted in green below.
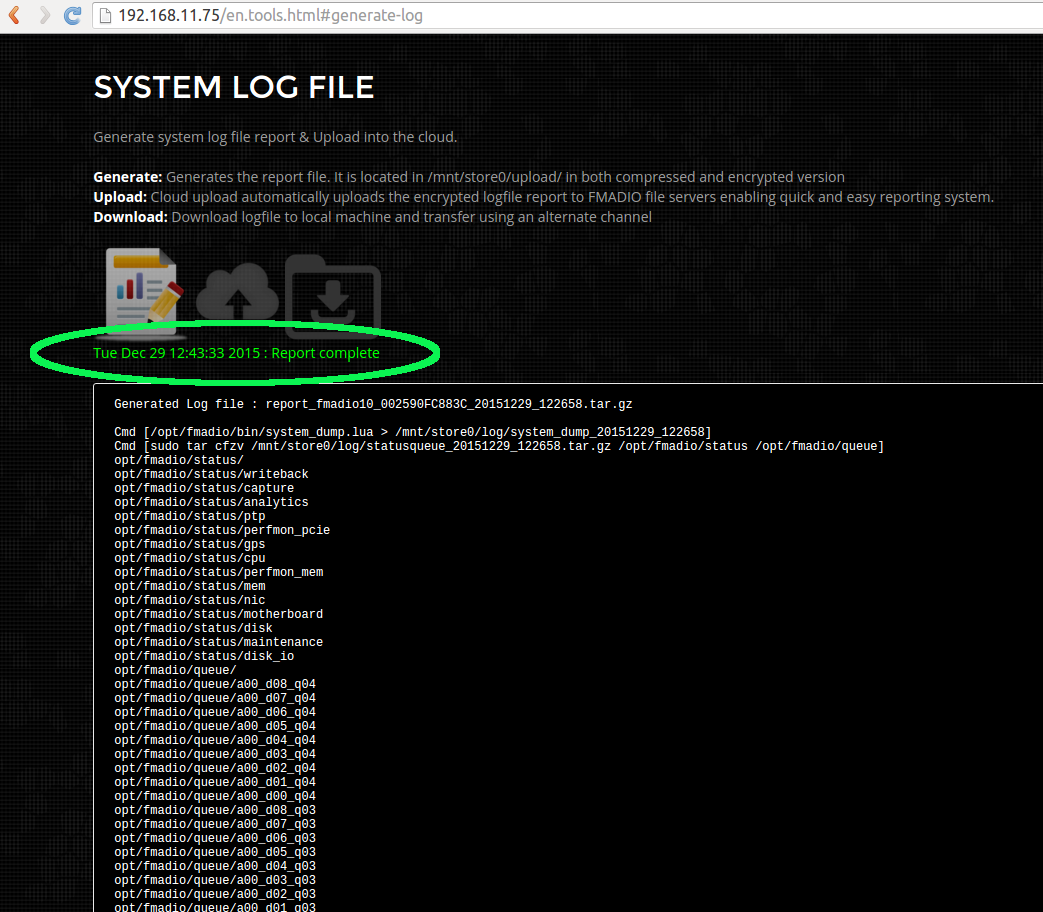
Step 5)
You can now download the report via the icon hilighted in Green. An example downloaded log file is shown in blue below. After download, transfer to us for further analysis.
Backup a)
If for some reason the Web GUI has failed the log files are located in this directory
fmadio@fmadio20-049:/mnt/store0/upload$ ls -al
total 2874860
drwxr-xr-x    2 root     root         36864 Dec 29 12:43 ./
drwxr-xr-x  169 fmadio   staff        12288 Dec 29 12:27 ../
-rw-r--r--    1 root     root        145024 Dec 29 12:27 filelist
lrwxrwxrwx    1 root     root            70 Dec 29 12:43 report.tar.gz -> /mnt/store0/upload/report_fmadio10_002590FC883C_20151229_122658.tar.gz
-rw-r--r--    1 root     root     1285506376 Dec 29 12:43 report.tar.gz.asc
-rw-r--r--    1 root     root     949296603 Dec 29 12:43 report_fmadio10_002590FC883C_20151229_122658.tar.gz
The file named filelist is the list of files contained in the logfile. There is a standard tarball and also encrypted tarball. Packet data is included in the log files and please unpack and check the contents complies with your companies security policy.
Backup b)
If logfile generation failed, you can manually invoke system log generation via command line, as shown below
fmadio@fmadio20-049:/mnt/store0/upload$ sudo /opt/fmadio/bin/syslog_report.lua
fmad fmadlua Dec 22 2015
calibrating...
0 : 00000000d09dad48           3.5000 cycles/nsec
Cycles/Sec 3499994440.0000 Std:       0cycle std(  0.00000000)
loading filename [/opt/fmadio/bin/syslog_report.lua]
Cmd [/opt/fmadio/bin/system_dump.lua > /mnt/store0/log/system_dump_20151229_132103]
loading filename [/opt/fmadio/bin/system_dump.lua]
[       iosched_direct.stdouterr_20151229]      1283855            1 MB
[            iosched_direct_20151229_1205]      1365723            2 MB
[               monitor_gps_20151229_1205]      9834318           12 MB
[            monitor_memory_20151229_1205]       809724           13 MB
[               monitor_nic_20151229_1205]      1179945           14 MB
[      statusqueue_20151229_132103.tar.gz]        40916           14 MB
[       stream_capture_sf20_20151229_1205]       288414           14 MB
[               monitor_cpu_20151229_1205]       642415           15 MB
[                 scheduler_20151229_1205]       404614           15 MB
[                             sfptp_stats]      3276884           19 MB
[     stream_writeback.stdouterr_20151229]       973105           20 MB
[          stream_writeback_20151229_1205]      1054488           21 MB
[             system_dump_20151229_132103]      1089180           22 MB
[      monitor_ptp.lua.stdouterr_20151229]        22197           22 MB
[               monitor_ptp_20151229_1205]       676222           23 MB
[        analytics.lua.stdouterr_20151229]        30954           23 MB
.
.
.
.
.
.
The resulting tarball logfile is located in /mnt/store0/upload/report_*.tar.gz Please scp off the device and send.
FMADIO AWS is a new way to capture and monitor all traffic in, out and within your Amazon Cloud. Feature requests and feedback are most welcome, our goal is to meet and exceed your requirements in every way.
Additional Info
FMADIO.AWS Cloud Packet Capture Overview | http://fmadio.io/blog-aws-packet-capture-ec2.html