fmadio.VOIP User Manual
Operating manual of VOIP Voice Over IP network packet capture analysis.
Contents
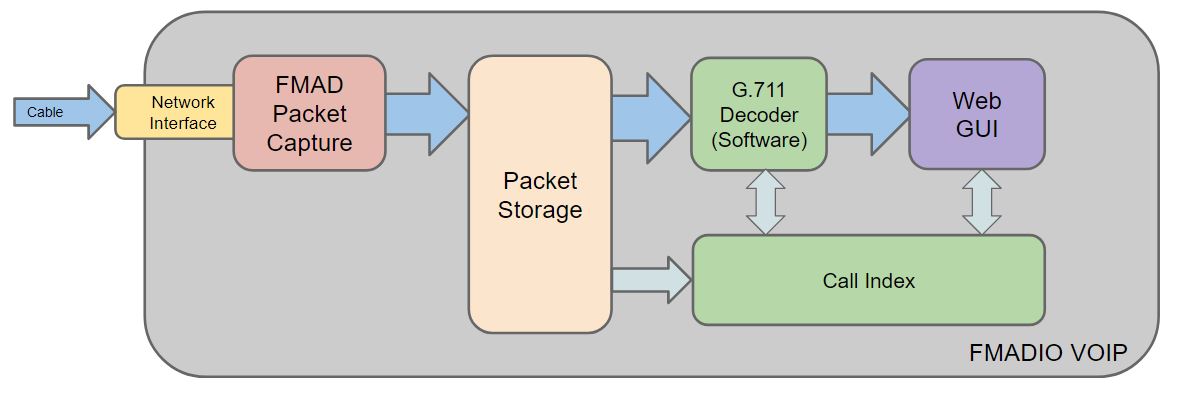
System Architecture
FMADIO VOIP
FMADIO VOIP Analytics decodes and splits VOIP traffic in realtime on all FMADIO Packet Capture hardware systems. It consists of small plugin with a full GUI for analysis.

Features:
- Realtime VOIP Decoding
- Realtime SIP / RTP Decoding
- One Call, One PCAP download
- Optional SIP Only PCAP Download
- Fast Easy to use GUI
- Expandable to most VOIP Protocols
Install
Installation
FMADIO VOIP Analytics is installed using our modular plugin architecture. Installation example as follows
fmadio@fmadio20-049:~$ plugin_reload.lua fmadio_voip_g711_20170706_2324.tcz

fmad fmadlua Jul  7 2017
calibrating...
0 : 3500000238           3.5000 cycles/nsec offset:0.000 Mhz
Cycles/Sec 3500000238.0000 Std:       0 cycle std(  0.00000000) Target:3.50 Ghz
argv /opt/fmadio/bin/fmadiolua
loading filename [/opt/fmadio/bin/plugin_reload.lua]
Sat Jul  8 21:28:28 2017 Plugin Load
Loading Plugin [fmadio_voip_g711_20170706_2324.tcz]
MD5: f4d5121be5914406ea931f6e2235cf3c  fmadio_voip_g711_20170706_2324.tcz
reloading voip  [g711]
Copying new firmware [fmadio_voip_g711_20170706_2324.tcz] -> /mnt/sda1/tce/optional/fmadio_voip_g711.tcz
Cmd [sudo cp -v fmadio_voip_g711_20170706_2324.tcz /mnt/sda1/tce/optional/fmadio_voip_g711.tcz]
Cmd [cp  /mnt/sda1/tce/onboot.lst /mnt/sda1/tce/onboot.lst.bak]
Cmd [cat /mnt/sda1/tce/onboot.lst.bak | grep -v analytics > /mnt/sda1/tce/onboot.lst]
Killing programs
Cmd [sudo /usr/local/bin/umount /tmp/tcloop/fmadio_voip_g711]
umount: /tmp/tcloop/fmadio_voip_g711: not mounted
Cmd [sudo mkdir -p /tmp/tcloop/fmadio_voip_g711]
Cmd [sudo /usr/local/bin/mount /mnt/sda1/tce/optional/fmadio_voip_g711.tcz /tmp/tcloop/fmadio_voip_g711 -t squashfs -o loop,ro,bs=4096]
Cmd [yes | sudo cp -ais /tmp/tcloop/fmadio_voip_g711/* / 2>/dev/null ]
-----------------------------------------------
Updated:
                                  -> market g711
                                  -> 354
                                  -> Thu Jul  6 23:24:44 2017
-----------------------------------------------
done 0.057625Sec 0.000960Min
The first time the plugin is loaded a full reboot is required. Other times the plugin reload might be required multiple times. This is due to not all processes and mounts completely unloading the first time (e.g. binaries still being used)
Historical VOIP Analysis
To run historical VOIP analysis on previously capture data, the following command is used:
/opt/fmadio/analytics/voip_g711_index.lua
Note that:
- All previous VOIP call history will be erased
- This process every capture on the system, unless --filter is specified
- --filter is a wildcard match / grep match on the capture name. It can match multiple capture names.
Using the --filter option to selectively re-index a capture or range of captures. Start by listing the current captures on the system
fmadio@fmadio20-100:/opt/fmadio/analytics$ sudo stream_dump
Streams:
 [0000]    [this should be empty]      0GB Chunk(Cnt:       0 Start:       1 End:       0) Inv:-nan Cap:-nan CacheI:-nan Cache:-nan Disk:-nan Drop:-nan Pkt:0
 [0001] remote_download_1499426232761_20170707_2017    149GB Chunk(Cnt:  610510 Start:      29 End:  610538) Inv:0.000 Cap:0.000 CacheI:0.000 Cache:1.000 Disk:0.000 Drop:0.000 Pkt:2000000000
 [0002] remote_download_1499426370829_20170707_2020    149GB Chunk(Cnt:  610510 Start:  610566 End: 1221075) Inv:0.000 Cap:0.000 CacheI:0.000 Cache:1.000 Disk:0.000 Drop:0.000 Pkt:2000000000
 [0003] remote_download_1499426876664_20170707_2028    149GB Chunk(Cnt:  610510 Start: 1221103 End: 1831612) Inv:0.000 Cap:0.000 CacheI:0.000 Cache:1.000 Disk:0.000 Drop:0.000 Pkt:2000000000
 [0004] remote_download_1499427389634_20170707_2036    149GB Chunk(Cnt:  610510 Start: 1831640 End: 2442149) Inv:0.000 Cap:0.000 CacheI:0.000 Cache:1.000 Disk:0.000 Drop:0.000 Pkt:2000000000
 [0005] remote_download_1499427898355_20170707_2045    149GB Chunk(Cnt:  610510 Start: 2442177 End: 3052686) Inv:0.000 Cap:0.000 CacheI:0.000 Cache:1.000 Disk:0.000 Drop:0.000 Pkt:2000000000
 [0006] remote_prefilter__1499429159692_20170707_2106      2GB Chunk(Cnt:    9572 Start: 3113817 End: 3123388) Inv:0.000 Cap:0.000 CacheI:0.000 Cache:1.000 Disk:0.000 Drop:0.000 Pkt:10850610
fmadio@fmadio20-100:/opt/fmadio/analytics$
In this specific case we want to re-index only the capture named remote_download_1499427898355_20170707_2045
To re-index only the capture remote_download_1499427898355_20170707_2045 run the following
fmadio@fmadio20-100:/opt/fmadio/analytics$ sudo ./voip_g711_index.lua  --filter remote_download_1499427898355_20170707_2045

fmad fmadlua Jul  7 2017
calibrating...
0 : 3499997611           3.5000 cycles/nsec offset:0.002 Mhz
Cycles/Sec 3499997611.0000 Std:       0 cycle std(  0.00000000) Target:3.50 Ghz
argv /opt/fmadio/bin/fmadiolua
argv remote_download_1499427898355_20170707_2045
loading filename [./voip_g711_index.lua]
G711 decoder Static Indexing
StartTime: 20170708_215908
OpenCtrl [/opt/fmadio/status/analytics] (fSysAnalytics_t*) Length 1048576B
Cmd[sudo killall g711_decoder]
killall: g711_decoder: no process killed
Cmd[sudo killall www_fcgivoip_g711]
Cmd[sudo killall stream_cat]
killall: stream_cat: no process killed
Cmd[sudo rm -Rf /mnt/store0/protocol/g711/]
Cmd[mkdir /mnt/store0/protocol/]
Cmd[mkdir /mnt/store0/protocol/g711/]
Adding Stream 5 @ [remote_download_1499427898355_20170707_2045]
Cmd[sudo /opt/fmadio/bin/stream_cat remote_download_1499427898355_20170707_2045 | sudo /opt/fmadio/bin/g711_decoder --stdin --cpu 10 --stream_index 5 >> /mnt/store0/log/g711_index_20170708_215908  & ]
reading PCAP from stdin
StreamIndex: 5
calibrating...
filename
calibrating...
0 : 00000000d09dafe8           3.5000 cycles/nsec
Cycles/Sec 3499995112.0000 Std:       0cycle std(  0.00000000)
0 : 3500819200           3.5008 cycles/nsec offset:0.819 Mhz
Cycles/Sec 3500819200.0000 Std:       0 cycle std(  0.00000000) Target:3.50 Ghz
Nano PACP
[Sat Jul  8 21:59:09 2017] G711 stream_cat: true 31.10GB g711 true 0.08GB
.
.
.
Which starts the re-indexing and may take 1 minute to several hours depending on the amount of data that needs to be processed. The GUI will be shutdown immediately after the command is issued and re-started in ~ 1 minute.
Running Analysis 24/7
Schedule 24/7 Operation
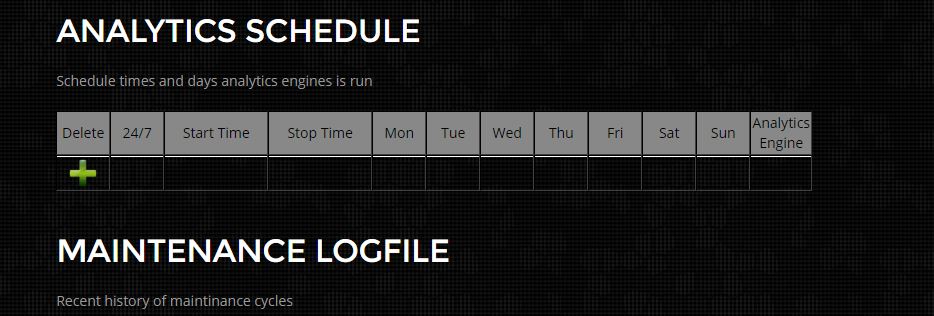
The VOIP Analytics are designed to run in "always on" 24/7 mode. It can also operate in a restricted hours / days mode if required. To setup navigate to the Config Menu as shown below in GREEN.

Scroll down the Analytics Schedule as shown below

Add a new row and change the Analytics Engine from "newrow0" -> voip_g711_realtime Its critical to use this extract name, otherwise the analytics will not be started. Then setup to run 24/7 Monday - Sunday as shown below.

At this point the voip analysis engine will spawn within ~ 1 minute (runs from a cronjob) and will begin processing the currently active capture, or wait until a capture has started.
VOIP System Status
Check Script
There are a number of way to monitor the health of the VOIP G.711 analysis software. The first check is ruining the built-in health check utility
/opt/fmadio/analytics/voip_g711_status.lua
The output is similar to this. You can see the GOOD status meaning the system is running as expected
fmadio@fmadio20-049:/opt/fmadio/analytics$ ./voip_g711_status.lua
fmad fmadlua Jul  8 2017
calibrating...
0 : 3499993012           3.5000 cycles/nsec offset:0.007 Mhz
Cycles/Sec 3499993012.0000 Std:       0 cycle std(  0.00000000) Target:3.50 Ghz
argv /opt/fmadio/bin/fmadiolua
loading filename [./voip_g711_status.lua]
----------------------------------------------------
Checking process`s are up
Found process [voip_g711_realtime.lua]
Found process [g711_decoder]
Found process [www_fcgivoip_g711]
Found process [g711_monitor]
----------------------------------------------------
Last Call ID:      GRTOT4643ZEUTEHKEVFFSNRFA4@x.x.x.x
Last Call Date:    20170705_224041
Last Call Start:   13:40:41.248.989.440
Last Call Stop:    13:40:41.702.597.707
Last Call Capture: remote_midroll_1499481861709971968_20170708_2359
----------------------------------------------------
voip_analytics_status: GOOD
----------------------------------------------------
done 0.140214Sec 0.002337Min
fmadio@fmadio20-049:/opt/fmadio/analytics$
G.711 Logfiles
For a more detailed investigation log files are best. The primary log file is in
/mnt/store0/log/g711_decoder.cur
Running tail -F /mnt/store0/log/g711_decoder.cur in an SSH window provides details on each VOIP call which has been decoded. If nothing is being output to this file it means no calls are currently being decoded
An example is shown below
fmadio@fmadio20-049:~$ tail -F /mnt/store0/log/g711_decoder.cur
13:01:34.080.041.984  22134 SIPSession CallID[407dbb2c03194ee7185f9c141e30f8fa@x.x.x.x:5000] To[48668104698@x.x.x.x] From[48222126200@x.x.x.x] Src[x.x.x.x. 73@62734] Dst[  0.  0.  0.  0@0] Proto:RTP/AVP Format:8
13:01:34.525.178.880  22651 SIPSession CallID[24353b8d13e73bfa37d54dae5bb11363@x.x.x.x:5000] To[48223970155@x.x.x.x] From[Anonymous@anonymous.invalid   ] Src[x.x.x.x@10274] Dst[  0.  0.  0.  0@0] Proto:RTP/AVP Format:8
13:01:34.535.633.920  22652 SIPSession CallID[6EK5RNRFJFDP5HIBJ4HYEYSSOE@x.x.x.x:5000] To[525541703993@x.x.x.x] From[525519594833@x.x.x.x] Src[x.x.x.x@13290] Dst[  0.  0.  0.  0@0] Proto:RTP/AVP Format:8
13:01:35.288.875.264  22653 SIPSession CallID[UUH7TII6E5GQBKFOV4B2K6H4GU@x.x.x.x:5000] To[525541693938@x.x.x.x] From[525552840200@x.x.x.x] Src[x.x.x.x@16240] Dst[  0.  0.  0.  0@0] Proto:RTP/AVP Format:8
VOIP System Restart
Restarting
In the event of a significant problem or decode hang status it many be required to forcibly stop analytics processing and wait for the system to restart. This will process stops all relevant processes.
1) Stop all analytics processing on the system
Disable analytics processing on the Config -> Analytics Schedule page as follows

2) Stop all analytics processing via CLI
In addition to the GUI, run the following CLI command to Terminate all processing currently active
/opt/fmadio/analytics/voip_g711_stop.lua
The output is similar to this.
fmadio@fmadio20-049:/opt/fmadio/analytics$ ./voip_g711_stop.lua
fmad fmadlua Jul 12 2017
calibrating...
0 : 3499995004           3.5000 cycles/nsec offset:0.005 Mhz
Cycles/Sec 3499995004.0000 Std:       0 cycle std(  0.00000000) Target:3.50 Ghz
argv /opt/fmadio/bin/fmadiolua
loading filename [./voip_g711_stop.lua]
killall: stream_cat: no process killed
killall: g711_decoder: no process killed
killall: g711_monitor: no process killed
killall: voip_g711_realtime.lua: no process killed
done 0.032480Sec 0.000541Min
fmadio@fmadio20-049:/opt/fmadio/analytics$
3) Clear the index
Clearing the Index deletes all call index meta data from the system.
/opt/fmadio/analytics/voip_g711_index.lua --clear-index --filter none
4) Re-Index any capture files
If re-indexing of any captured data is required, Run the following, this may take some time (multi hours) depending on how much data needs to be processed
Replace YYYMMDD with Year Month Day, e.g. January 1st 2020 would be 20200101
/opt/fmadio/analytics/voip_g711_index.lua --filter YYYYMMDD
5) Re-Enable Analytics on the GUI
Re-enable the analytics on the dashboard as follows for 24/7 processing.

After running the above command the GUI and backend systems have stopped. This can be confirmed using the status utility /opt/fmadio/analytics/voip_g711_status.lua It will take ~ 1 minute for the analytics to spinup, please wait..
Analysis Dashboard
Dashboard
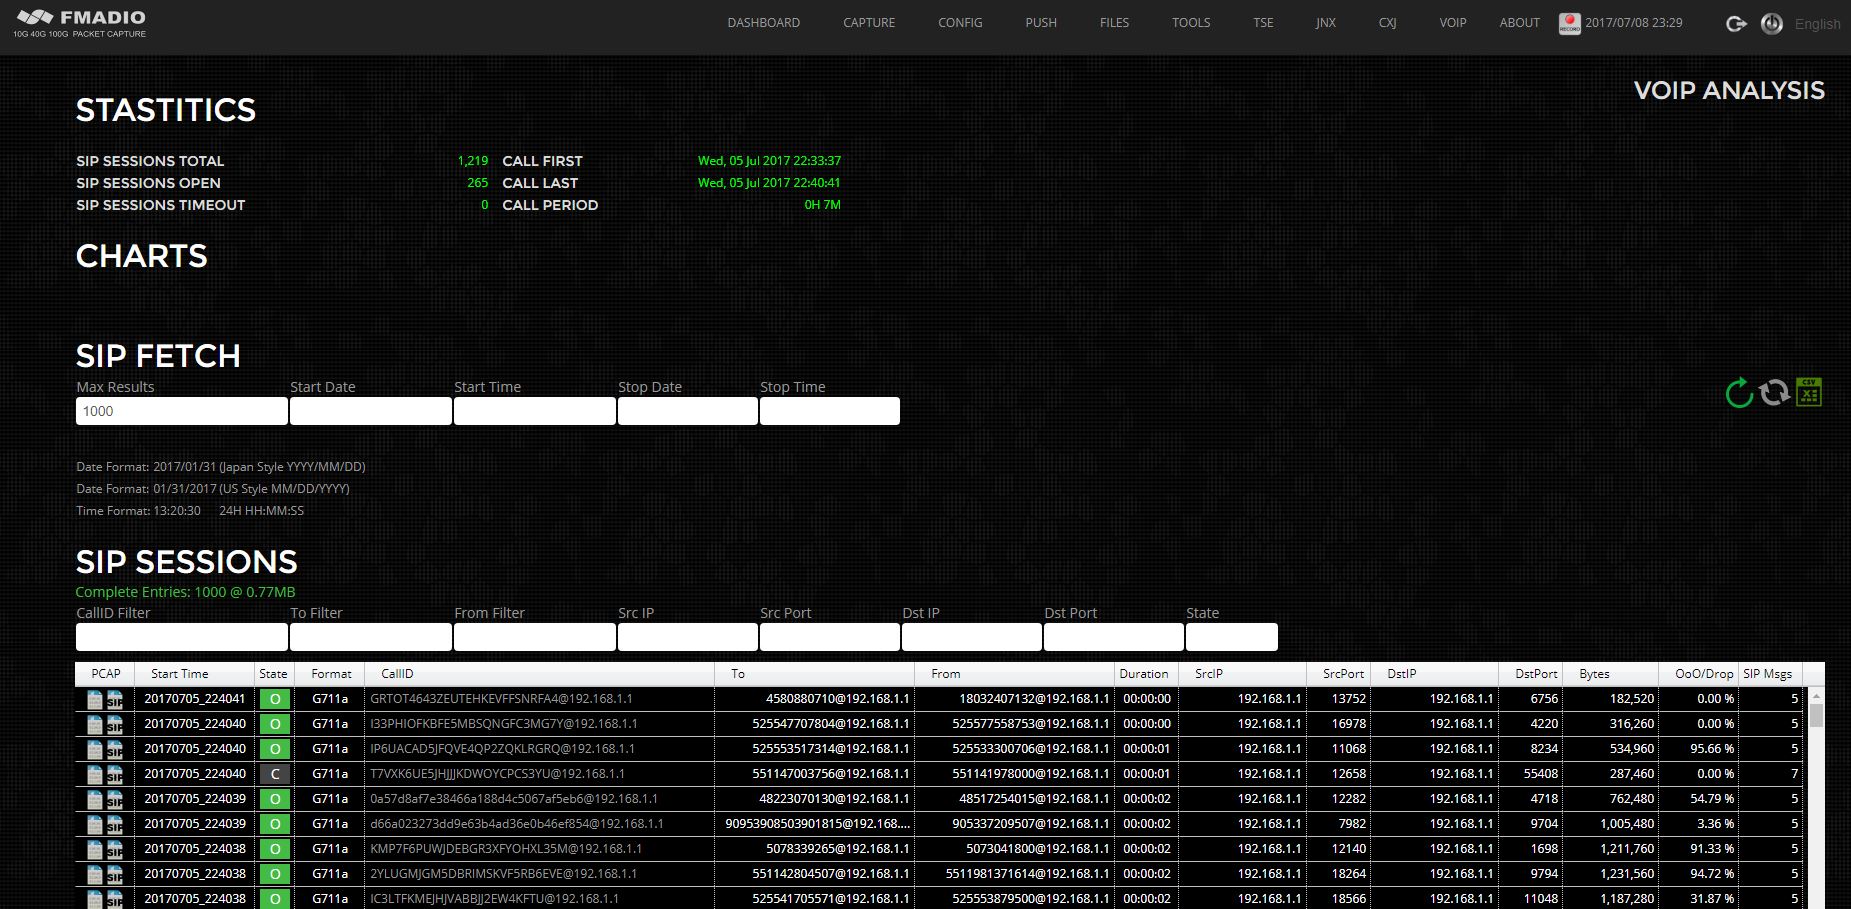
VOIP Analysis Dashboard provides high level statistics on the currently indexed calls. An example is shown below.

In this example it shows
- SIP Sessions Total : Total number of calls on indexed on the device
- SIP Sessions Open : Total number of open calls indexed on the device
- SIP Sessions Timeout : Total number calls that have timed out
- Call First : Date and time of the first call currently indexed on the device
- Call Last : Date and time of the last call currently indexed on the device
- Call Period : Number of hours and minutes currently indexed on the box. Expected to be 100`s of hours
Disk Full
To clarify the disk storage model, FMAD Packet Capture systems operate in a FIFO disk storage mode. The disk never gets full, it rotates data off the device in a First In First Out mode. As a result capture data organically rolls off the device. The "Call First" statistic shows the last call that is currently on the device, its accuracy is +/- 5 minutes or so. And the Call Period shows the amount of wallclock time is on the device.
VOIP Calls
Fetching Calls
FMADIO VOIP Analytics Web GUI automatically fetches the latest 1000 calls on the system, the result is similar to the screenshot below.

To drill down in a bit more detail start with the "SIP Fetch" options. This is what actually gets fetched across from the FMAD VOIP Analytics Packet Capture system to your local machine. Where as the "SIP Sessions" filters are all performed in memory on your local machine with no data fetches from the FMADIO Device.

The above image shows the SIP Fetch parameters. The search fields are all options. If a Time is specified without a Date the current date will be used.
At the end of the SIP Fetch bar are the follow icons shown below
The GREEN arrow icon, this issues a single one shot fetch based on the current parameters.
The GREY double arrow icon, this turns on continuous update. It will re-fetch the data every 10 seconds automatically. When activated the icon becomes green.
The CSV Icon is to download the current SIP Session log in CSV format
VOIP Calls PCAP Download
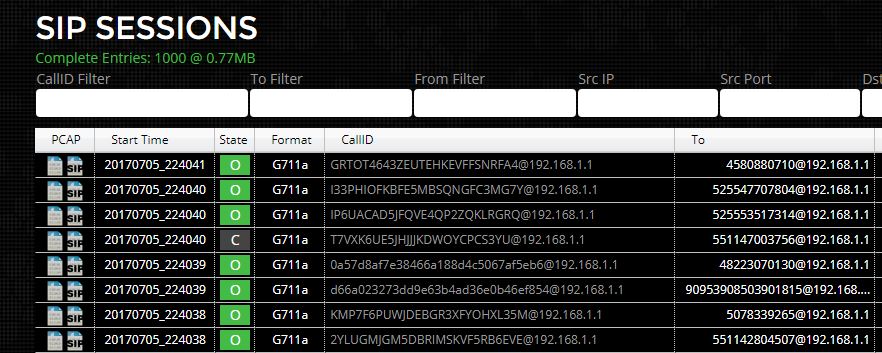
Calls can be downloaded in PCAP format by clicking on the PCAP icons. The icon with SIP is for SIP only data (excluding the actual RTP / voice data). This can be very helpful to debug issues without having to download a large PCAP.

The State field indicates the call state as follows
- C - Call is Closed
- O - Call is Open
- T - Call has timed out
VOIP Calls Index Dump
The full call index can be dumped in text format as follows
fmadio@fmadio20-049:$ sudo g711_dump  --call-list
[   165] SIP Session CallID:[7ODAEOB3DZGTHGFK22JIJ2KTPY@xxx.xxx.xxx.xxx                    ] Start:16:16:40.657.726.976 Stop:16:16:59.711.193.088 Duration:00:00:19.053.466.112 State:C StreamCnt: 1 RTP0 [SeqNo:   56202 Drop:   264 Gap:    11 Pkts:       417 Bytes:     75060] RTP1[SeqNo:    5904 Drop:     0 Gap:     0 Pkts:       686 Bytes:    123480]
[   263] SIP Session CallID:[1896384222_133409924@xxxx.xxxx.xxxx.xxx                       ] Start:16:18:18.677.912.064 Stop:16:59:33.807.396.096 Duration:00:41:15.129.484.032 State:C StreamCnt: 1 RTP0 [SeqNo:   20839 Drop:   233 Gap:    12 Pkts:    123412 Bytes:  22214160] RTP1[SeqNo:   47452 Drop:     0 Gap:     0 Pkts:    123643 Bytes:  22255740]
[   835] SIP Session CallID:[0e65204c2d3d9e360cf80c493ca17136@xxx.xxx.xxx                  ] Start:16:37:40.264.304.128 Stop:16:48:02.445.062.912 Duration:00:10:22.180.758.784 State:C StreamCnt: 1 RTP0 [SeqNo:   10262 Drop: 26365 Gap:     4 Pkts:     30745 Bytes:   5534100] RTP1[SeqNo:   45639 Drop:  1234 Gap:     1 Pkts:     31040 Bytes:   5587200]
.
.
.
Using a simple grep on the output allows searching for partial matches when digging into more obscure issues
e.g. searching for a partial calli containing "7ODAEOB"
fmadio@fmadio20-049:$ sudo g711_dump  --call-list  | grep 7ODAEOB
[   165] SIP Session CallID:[7ODAEOB3DZGTHGFK22JIJ2KTPY@xxx.xxx.xxx.xxx                    ] Start:16:16:40.657.726.976 Stop:16:16:59.711.193.088 Duration:00:00:19.053.466.112 State:C StreamCnt: 1 RTP0 [SeqNo:   56202 Drop:   264 Gap:    11 Pkts:       417 Bytes:     75060] RTP1[SeqNo:    5904 Drop:     0 Gap:     0 Pkts:       686 Bytes:    123480]
VOIP API
JSON Interface
All VOIP data can be access via a simple JSON based HTTP(s) API interface. This enables a simple curl/wget operation to search and fetch the raw data. The API interface is exactly the same interface the browser based WebGUI uses internaly. Thus the output of the GUI and API are identical.
There are 3 function calls:
http://192.168.1.1/voip/sip/json/stats
http://192.168.1.1/voip/sip/json/list
http://192.168.1.1/voip/sip/json/detail
These calls provide everything required for a 3rd party integration with our VOIP platform. Details on the function calls are as follows
G.711 API JSON Status
http://192.168.1.1/voip/sip/json/stats
This provide high level status of the currently indexed calls on the system. Example output is shown below
$ curl -u xxxx:xxxx http://192.168.1.1/voip/sip/json/stats
{"calls_total":3154,"calls_open":61,"calls_timeout":0,"calls_first":"Sat, 04 Feb 2017 01:14:41 ","calls_last":"Sat, 04 Feb 2017 07:44:37 ","calls_period":"6H 29M","pad":0}
$
From the json data it provides high level statsitics such as total calls indexed, time of the first call, last call and total number of hours indexed on the device. It mirrors the dashboard status information
G.711 API JSON List
http://192.168.1.1/voip/sip/json/list
List provides a way to search for specific calls, the arguments are as follows
| Argument Name | Value | Example |
| CallID | Full Call ID to search for | CallID=ABCDEFG@192.168.1.1 |
| StartDate | Call Data to begin the search from. Format is in YYYY/MM/DD If no date is specified todays date is used | StartDate=2017/12/01 (From 1st December 2017) |
| StopDate | Call Data date limit for call search. Format is in YYYY/MM/DD If no date is specified todays date is used | StopDate=2017/12/31 (From 31st December 2017) |
| StartTime | Time to start the call searching. Format is in 24H time HH:MM:SS Note if no time is specified 00:00:00 is used | StartTime=09:30:00 (Start search from 09:30:00) |
| StopTime | Time to stop the call searching. Format is in 24H time HH:MM:SS Note if no time is specified 23:59:59 is used | StopTime=17:30:00 (Stop search before 17:30:00) |
| MaxEntries | Provide the maximum number of calls to return. Default value is 4096 calls | MaxEntries=1000 (return a maximum of 1000 calls) |
The return value of this function provides additional details of each call that matched the search criteria (NOTE: the JSON data has been formatted easy reading)
$ curl -u fmadio:100g http://192.168.1.1/voip/sip/json/list?MaxEntries=5
{"Table":[
	{	"id":0,
		"TS":"20170101_074437",
		"TSLen":"00:00:03",
		"CallID":"6F4H2MFAEJA7NBLZLLBHPEJ6QM@192.168.82.106",
		"To":"442080682234@192.168.64.66",
		"From":"14702382039@192.168.1.1",
		"State":"O",
		"Format":"G711a",
		"SrcIP":"192.168.82.231",
		"SrcPort":"18650",
		"DstIP":"192.168.64.72",
		"DstPort":"2584",
		"Bytes":61740,
		"Drop":0,
		"SIPMsg":5,
		"PCAPFull":"/pcap/multi?StreamList=4,&SIPCall=6F4H2MFAEJA7NBLZLLBHPEJ6QM@192.168.82.106,192.168.82.45,5060,192.168.64.66,5060,192.168.82.231,18650,192.168.64.72,2584,1486161877218160896,1486161880811205888,20170101_074437",
		"PCAPSIP":"/pcap/multi?StreamList=4,&SIPCall=6F4H2MFAEJA7NBLZLLBHPEJ6QM@192.168.82.106,192.168.82.45,5060,192.168.64.66,5060,192.168.82.231,18650,192.168.64.72,2584,1486161877218160896,1486161880811205888,20170101_074437,SIPOnly",
		"Detail":"/en.voip.g11.sipdetail.html"
	},
	{
		"id":1,
		"TS":"20170101_074430",
		"TSLen":"00:00:04",
		"CallID":"UFZBCHIJVRDL5ACFY4QS4V5MVI@192.168.82.107",
		"To":"442080682239@192.168.64.66",
		"From":"14702382039@192.168.82.45",
		"State":"C",
		"Format":"G711a",
		"SrcIP":"192.168.82.214",
		"SrcPort":"14320",
		"DstIP":"192.168.64.72",
		"DstPort":"2582",
		"Bytes":68760,
		"Drop":0,
		"SIPMsg":6,
		"PCAPFull":"/pcap/multi?StreamList=4,&SIPCall=UFZBCHIJVRDL5ACFY4QS4V5MVI@192.168.82.107,192.168.82.45,5060,192.168.64.66,5060,192.168.82.214,14320,192.168.64.72,2582,1486161870624497920,1486161875541998080,20170101_074430",
		"PCAPSIP":"/pcap/multi?StreamList=4,&SIPCall=UFZBCHIJVRDL5ACFY4QS4V5MVI@192.168.82.107,192.168.82.45,5060,192.168.64.66,5060,192.168.82.214,14320,192.168.64.72,2582,1486161870624497920,1486161875541998080,20170101_074430,SIPOnly",
		"Detail":"/en.voip.g11.sipdetail.html"
	},
	.
	.
	.
	.
]}

$
For example to download the Call`s SIP + RTP data for the call 6F4H2MFAEJA7NBLZLLBHPEJ6QM@192.168.82.10, use the field PCAPFull as the URI of a CURL request. For example:
curl -u xxxx:xxxx "http://192.168.1.1/pcap/multi?StreamList=4,&SIPCall=6F4H2MFAEJA7NBLZLLBHPEJ6QM@192.168.82.106,192.168.82.45,5060,192.168.64.66,5060,192.168.82.231,18650,192.168.64.72,2584,1486161877218160896,1486161880811205888,20170101_074437" > call.pcap
An detailed explaination of each field as follows:
| Field | Description | Example |
| id | search return index (up to MaxEntries) | 1 |
| TS | Time Stamp Date + Time format YYYYMMDD_HHMMSS) | 20170101_074430 |
| CallID | Extracted CallID | UFZBCHIJVRDL5ACFY4QS4V5MVI@192.168.82.107 |
| To | Call To address | 442080682234@192.168.64.66 |
| From | Call From Address | 14702382039@192.168.1.1 |
| State | Call State, O - Open, C - Close, T - Timeout, I - Invite | O |
| Format | Audio Codec Format | G711a |
| SrcIP | RTP Audio Codec Src IP | 192.168.82.231 |
| SrcPort | RTP Audio Codec Src Port | 18650 |
| DstIP | RTP Audio Codec Dst IP | 192.168.64.72 |
| DstPort | RTP Audio Codec Dst Port | 2584 |
| Bytes | Total number of bytes (SIP + RTP) | 61740 |
| SIPMsg | Total number of SIP messages parsed | 5 |
| PCAPFull | URI link to download the full Call (SIP + RTP) PCAP | /pcap/multi?StreamList=4,&SIPCall=6F4H2MFAEJA7NBL.... |
| PCAPSIP | URI link to download the SIP only data of the Call as a PCAP | /pcap/multi?StreamList=4,&SIPCall=6F4H2MFAEJA7NB.... |
FMADIO VOIP Analysis is a cost effective way to monitor and analyize G.711 based VOIP network packet traffic

