Centralized System Monitoring ELK
In any environment it is important to monitor the performance of systems, whether they be servers, infrastructure or monitoring and security tools. 10G 40G 100G packet capture systems are no different. Systems monitoring in large organizations, where a significant number of tools from different vendors are used, can be piecemeal unless an industry standard method is used. For decades the standard of choice was SNMP, and this still has its place, but in pursuit of simplicity and reliability, customers have pushed for other methods of monitoring.
HTTP based RESTful APIs provide a solution to meet this requirement. By leveraging a protocol that is simple but reliable and flexible, working with REST queries is easy.
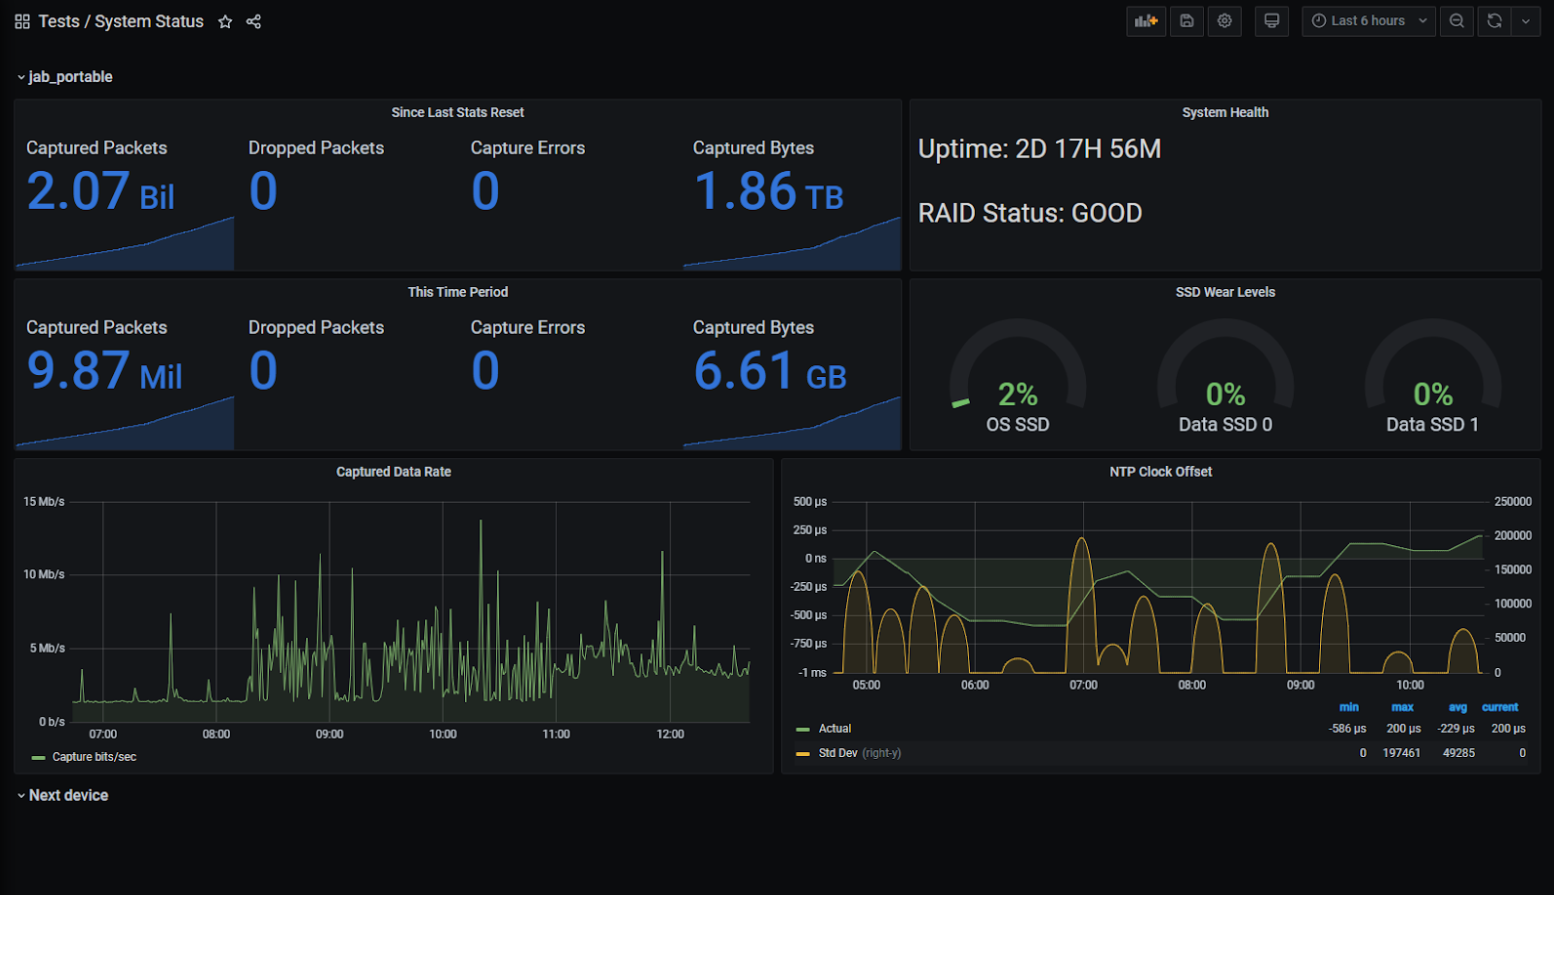 As an example, the dashboard above in Grafana can be used to monitor the health of FMADIO 10G 40G 100G packet capture appliances. Though it's only monitoring one test appliance, additional systems would appear as sections below this with the same visualisations, and an overview section at the top to show alerts and the most important metrics could be added.
This article is a walkthrough of how this was done. It is not meant to be exhaustive, but a starting point for system monitoring.
Centralized Device Monitoring
The technologies used in this example are as follows:
- FMADIO 10G 40G 100G packet capture appliance, the system that we are monitoring.
- Open source Elasticsearch system with Logstash and Grafana installed on the same system.
Logstash uses its http_poller input method to pull data from the FMADIO 10G 40G 100G packet capture appliance and outputs it to Elasticsearch where it is stored. Grafana then pulls the data that it needs from Elasticsearch, makes relevant calculations and displays/alerts on the derived data.
This article does not cover the installation and general configuration of Elasticsearch, Logstash and Grafana, and assumes a reasonable working knowledge of these.
Fetching the Data
Lets start with the data itself. There is load more detail on the FMADIO REST API to be found in the documentation: https://fmad.io/en.fmadio10-manual.html#api and one can use Postman or a similar client to look at the out from the System Status call:
(Yes, this running over HTTP in a test environment, but HTTPS would be more suitable in production)
GET http://192.168.168.19/sysmaster/stats_summary

{
  "uptime": "2D 17H 18M",
  "capture_received": 2074484131,
  "capture_bytes": 1866539399345,
  "capture_dropped": 0,
  "capture_errors": 0,
  "generate_sent": 0,
  "generate_bytes": 0,
  "generate_errors": 0,
  "bytes_pending": 0,
  "bytes_disk": 0,
  "bytes_overflow": 0,
  "smart_errors": 0,
  "raid_errors": 0,
  "stream_errors": 0,
  "chunk_errors": 0,
  "ecc_errors": 0,
  "packets_oldest": "03 Feb 2021 22:48:53",
  "packets_oldest_ts": "1612392533937173248",
  "capture_days": "14D 13H  7M",
  "total_capture_byte": 1024219152384,
  "total_store_byte": 0,
  "max_store_byte": 1024219676672,
  "average_compression": "0",
  "disk_os0_valid": true,
  "disk_os0_serial": "191033801656",
  "disk_os0_smart": 0,
  "disk_os0_temp": 38,
  "disk_os0_read_error": 0,
  "disk_os0_dma_error": 0,
  "disk_os0_reallocate": 0,
  "disk_os0_block_free": 0,
  "disk_os0_link_speed": 6,
  "disk_os0_wear_level": 2,
  "disk_os0_total_write": 2.857,
  "disk_os0_desc": "GOOD",
  "disk_ssd0_valid": true,
  "disk_ssd0_serial": "S469NF0KA01148M",
  "disk_ssd0_smart": 0,
  "disk_ssd0_temp": 34,
  "disk_ssd0_read_error": 0,
  "disk_ssd0_dma_error": 0,
  "disk_ssd0_reallocate": 0,
  "disk_ssd0_block_free": 0,
  "disk_ssd0_link_speed": 24,
  "disk_ssd0_wear_level": 0,
  "disk_ssd0_total_write": 2.757597696,
  "disk_ssd0_desc": "GOOD",
  "disk_ssd1_valid": true,
  "disk_ssd1_serial": "S469NF0KA01232P",
  "disk_ssd1_smart": 0,
  "disk_ssd1_temp": 41,
  "disk_ssd1_read_error": 0,
  "disk_ssd1_dma_error": 0,
  "disk_ssd1_reallocate": 0,
  "disk_ssd1_block_free": 0,
  "disk_ssd1_link_speed": 24,
  "disk_ssd1_wear_level": 0,
  "disk_ssd1_total_write": 2.757612032,
  "disk_ssd1_desc": "GOOD",
  "raid_status": "GOOD",
  "eth0_link": 1,
  "eth0_link_uptime": "2D 17H 17M",
  "eth0_speed": 1,
  "man0_link": 0,
  "man0_link_uptime": "0D 0H 0M",
  "man0_speed": 0,
  "man0_mode": "",
  "man0_wavelength": "",
  "man0_vendor": "",
  "man0_vendorpn": "",
  "man0_powerrx": "",
  "man0_powertx": "",
  "man0_voltage": "",
  "man0_temperature": "",
  "man0_error_code": 0,
  "man0_error_other": 0,
  "cap0_link": 0,
  "cap0_link_uptime": "0D 0H 0M",
  "cap0_speed": 1,
  "cap0_mode": " 1G BASE-T",
  "cap0_wavelength": " 16652nm",
  "cap0_vendor": " fmadio          ",
  "cap0_vendorpn": " SFP-GB-GE-T     ",
  "cap0_powerrx": " 0.000 mW",
  "cap0_powertx": " 0.000 mA",
  "cap0_voltage": "  0.000 V",
  "cap0_temperature": " 0.000 C",
  "cap1_link": 1,
  "cap1_link_uptime": "2D 17H 17M",
  "cap1_speed": 1,
  "cap1_mode": " 1G BASE-T",
  "cap1_wavelength": " 16652nm",
  "cap1_vendor": " fmadio          ",
  "cap1_vendorpn": " SFP-GB-GE-T     ",
  "cap1_powerrx": " 0.000 mW",
  "cap1_powertx": " 0.000 mA",
  "cap1_voltage": "  0.000 V",
  "cap1_temperature": " 0.000 C",
  "clock_gm_mac": "none",
  "clock_gm_sync": 0,
  "clock_gm_offset_mean": 0,
  "clock_gm_offset_stddev": 0,
  "clock_gm_uptime": "0D 0H 0M",
  "clock_sys_sync": 0,
  "clock_sys_offset_mean": 0,
  "clock_sys_offset_stddev": 0,
  "clock_sys_uptime": "0D 0H 0M",
  "clock_isys_sync": 1,
  "clock_isys_offset_mean": -7.7265623451266,
  "clock_isys_offset_stddev": 359.34844292535,
  "clock_isys_uptime": "2D 17H 18M",
  "clock_pps_sync": 1,
  "clock_pps_offset_mean": 0,
  "clock_pps_offset_stddev": 0,
  "clock_pps_uptime": "2D 17H 18M",
  "clock_ntp_master": "*192.168.168.5",
  "clock_ntp_sync": 1,
  "clock_ntp_offset_mean": 333440,
  "clock_ntp_offset_stddev": 163861.42438048,
  "clock_ntp_uptime": "2D 17H 18M",
  "pad": "0"
}
So, theres a lot of information pulled down by this request. The highlighted fields are among the most interesting, but that would change depending on what you are trying to achieve and how your system is configured. For example, this test appliance is using NTP for time synchronisation, which is fine for these purposes, but in a highly regulated environment, PTP or PPS may be more suitable, and the clock offset variable would change based on that.
Getting Logstash to pull this information on a regular basis is simple; all we need is a pipeline configuration in /etc/logstash/conf.d. Here is an example:
input {
  http_poller {
    urls => {
        jab_portable => {

        method => get
        user => "fmadio"
        password => "100g"
        url => "http://192.168.168.19/sysmaster/stats_summary"
        headers => {
          Accept => "application/json"
        }
     }
    }
    request_timeout => 60
    # Supports "cron", "every", "at" and "in" schedules by rufus scheduler
    schedule => { cron => "* * * * * UTC"}
    codec => "json"
    # A hash of request metadata info (timing, response headers, etc.) will be sent here
    metadata_target => "http_poller_metadata"
  }
}


output {
  elasticsearch {
	hosts => ["192.168.168.18:9200"]
	manage_template => true
	index => "fmadio_system_status-%{+yyyy-MM-dd}"
	template => "/etc/logstash/templates/fmadio_system_status_template.json"
	template_name => "fmadio_system_status_template"
	template_overwrite => true
	}
}
The input section defines the retrieval of the data from the appliance. Key variables are:
- The poller name (jab_portable in my case). This will define the appliance name in Elasticsearch.
- Credentials for authentication (obviously you shouldn’t use the defaults like I am).
- The IP address or FQDN of the appliance.
- The cron schedule, to define how often the data is updated. Its set for 1 minute updates, which is plenty granular.
The output section defines what happens to the data, in this case storing it in Elasticsearch. Key variables are:
- Hosts - your Elasticsearch system
- The index that you want the data to go into (I have this creating a new index each day).
- Template information on how to store the data.
The template information can be very important. Fields with type “text” cannot be searched or aggregated, so ensure that the needed fields are of the type “keyword”. A good example of this is the field raid_status. The template I used for this is too big to post here, but if you need it, just ask support@fmad.io.
OK, so data is now being stored in Elasticsearch, and visualising it is very simple.
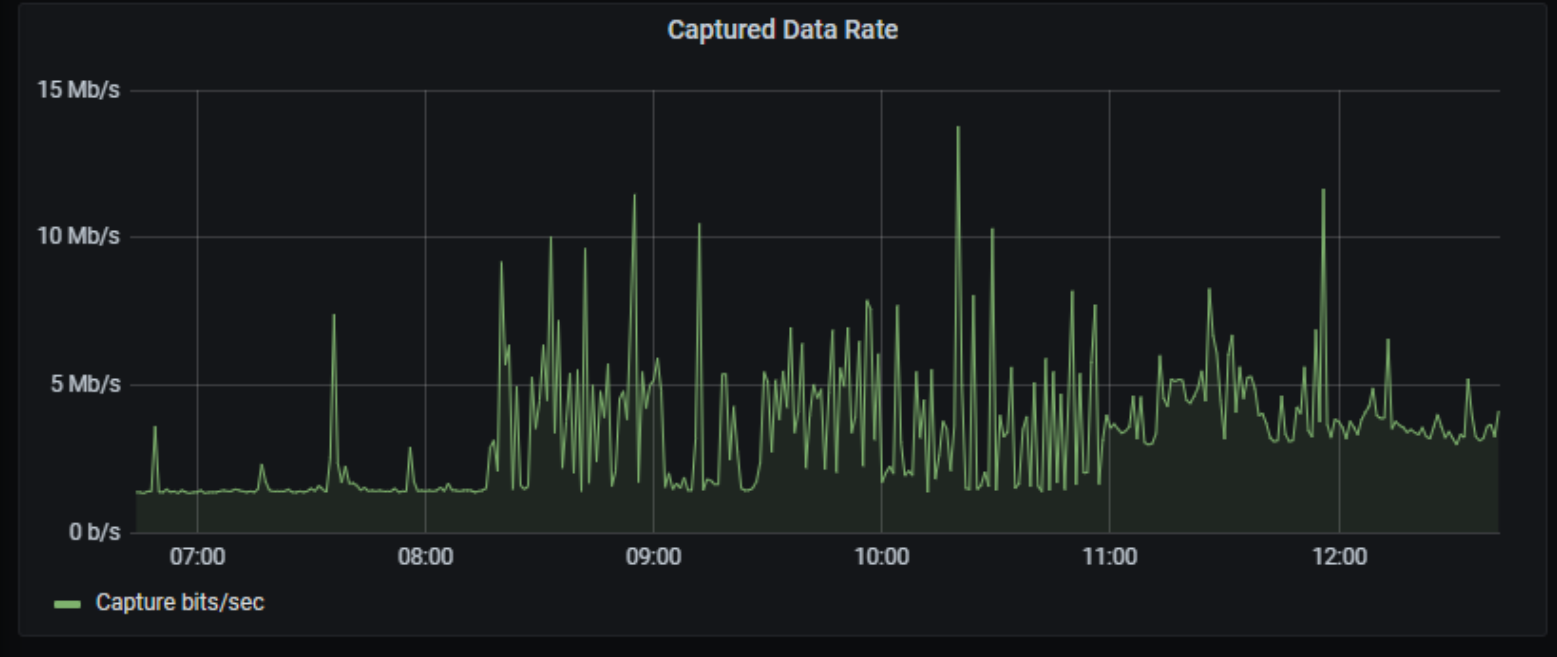
Probably the trickiest visualisation is captured bytes over time graph as we have to convert a counter into a delta. In Grafana this is achieved with a derivative, like this:
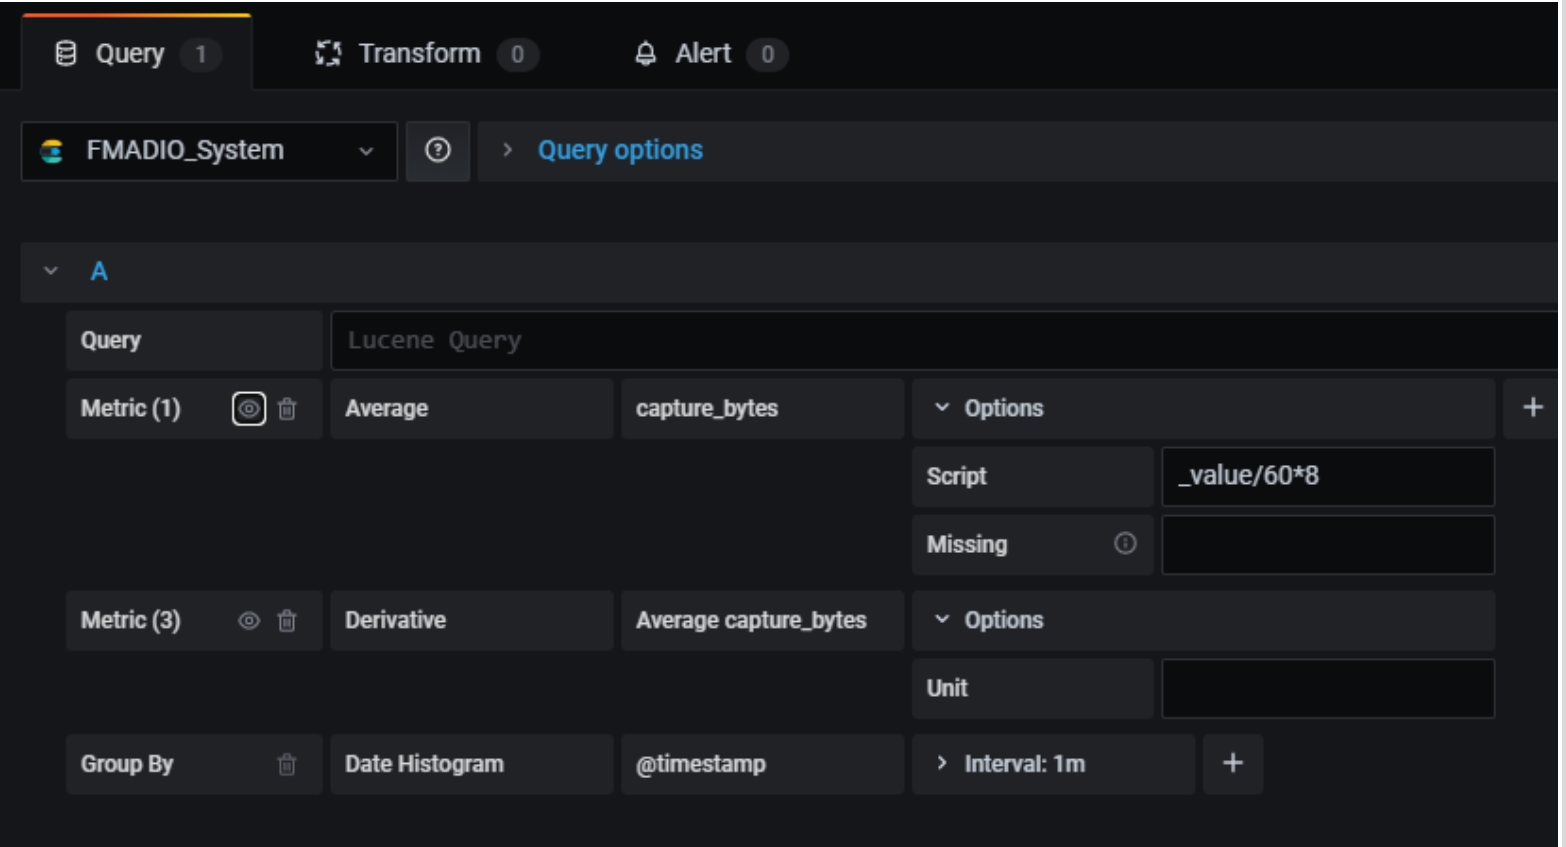
Note that dividing the value by 60 and multiplying by 8 turns MB/minute into Mb/second. Then hide the original data with the eye icon:
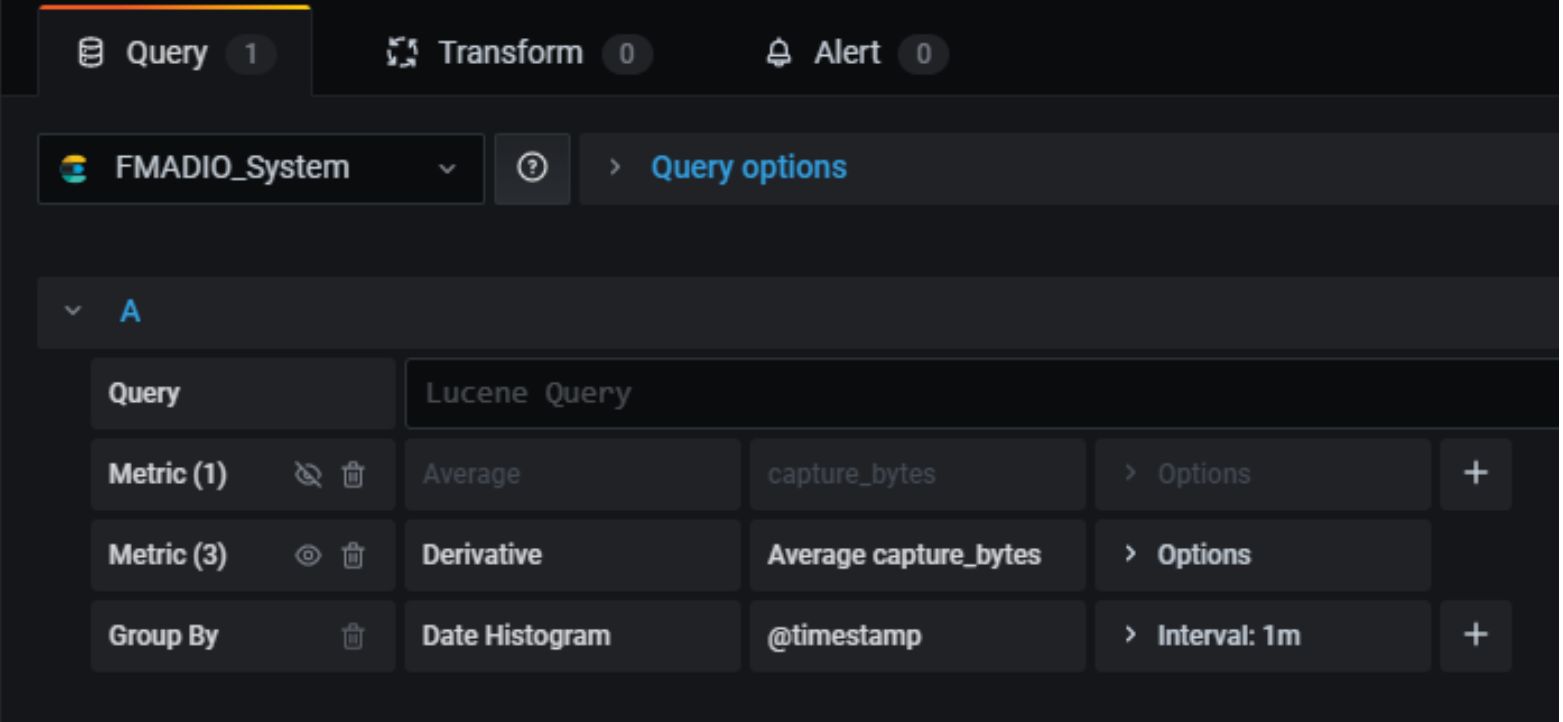
And you get:
The rest of the visualisations are representations of raw data from Elasticsearch.
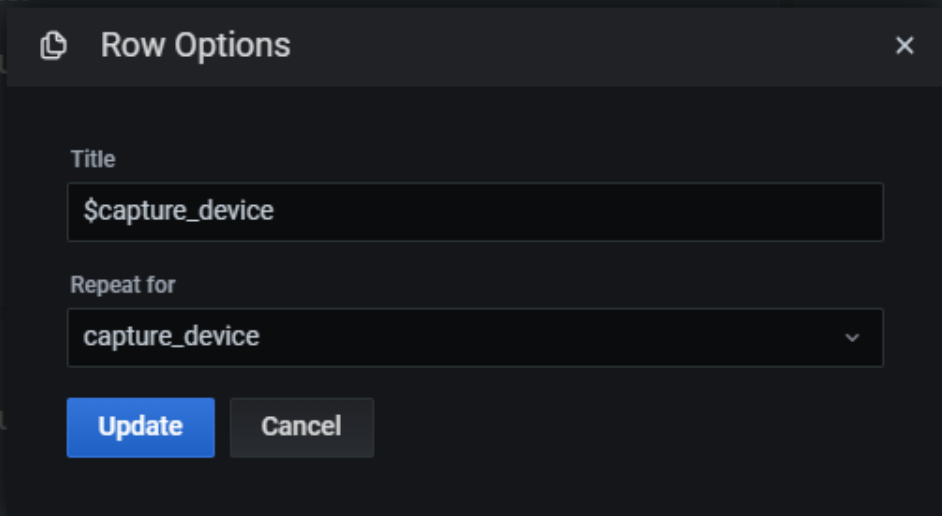
The only other thing to mention is creating a section for each 10G 40G 100G packet capture system so that data from multiple appliances are automatically populated in the same way.
To do this, start with a variable called capture_device with the following settings:
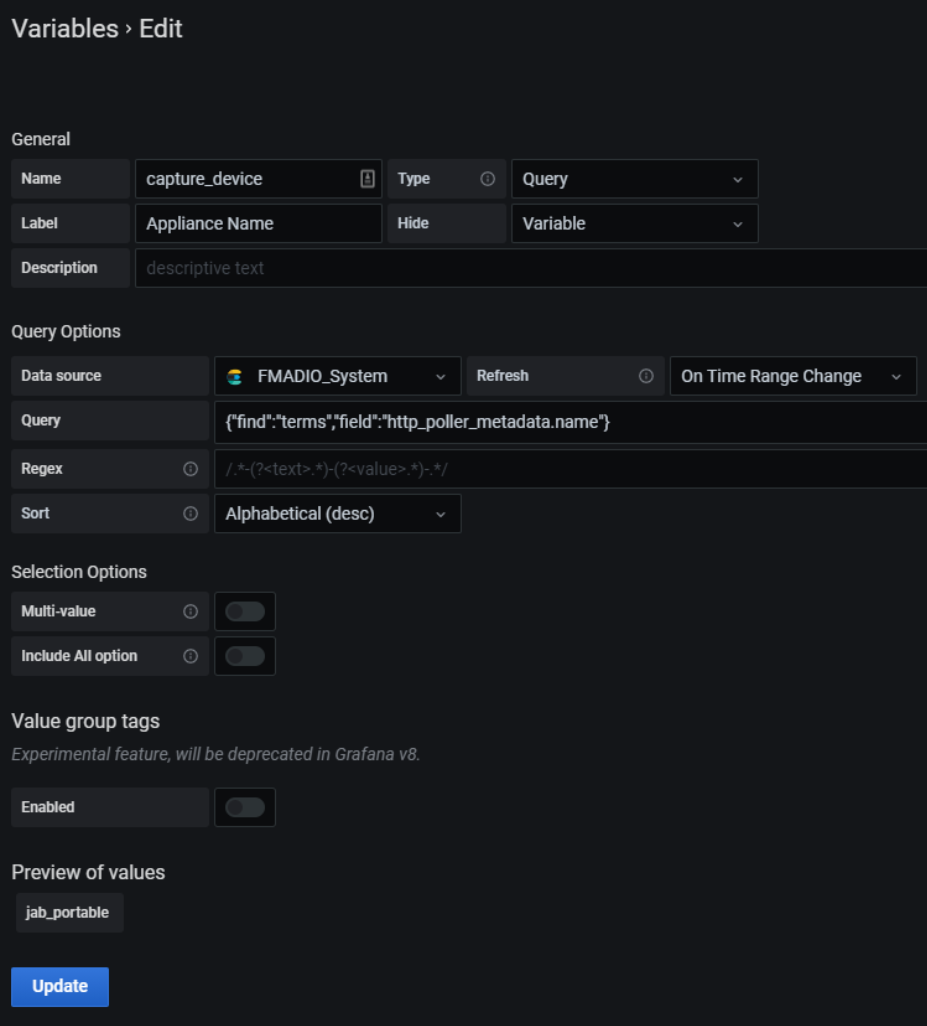
Then in the Row Options in the dashboard, create a repeating row for each instance of capture_device:
We hope this shows a simple and effective way to monitor your all your FMADIO Network Packet Capture devices, Any questions or comments feel free to contact us about 10G 40G 100G Packet Capture, Network Analysis and anything inbetween!


