PCAP Network Flow Monitoring
Network Flow Monitoring
Good visibility and understanding of how traffic moves though your infrastructure is extremely critical to any Network Operations Center (NOC) and Security Operations Center (SOC) yet there are many approaches. Some are easy, some are hard, some are expensive and some are free.
FMADIO 10G 40G 100G Packet Capture systems combined with Open Source software enables a new kind of visibility and monitoring capabilities using our full packet capture systems. Our packet capture systems are multipurpose, used for troubleshooting, deep dives with Wireshark but also excellent monitoring capabilities!
FMADIO developed pcap2json utility which converts a PCAP into ElasticSearch bulk upload JSON, it even uploads fully compressed JSON directly into ElasticSearch without LogStash. Its free and OpenSource on GitHub, and can use any PCAP file.

Netflow Monitoring "netflow"
One of the basic ways to monitoring traffic is via Network Flows / IPFIX where you put a device onto your network that calculates statistics for each and every network flow. A network flow in this case is a unique 7-tuple IP Src/Dst, Protocol, Port Src/Dst, ingress/egress port. Usually the TOR switch generates the flows, however there are a number problems with this.
The biggest problem is performance. Switches and Routers are designed to move packets around, their not so good at running high CPU and RAM usage software. As such generating IPFIX data on your Cisco router can create some pretty significant performance penalties as its CPU gets backed up calculating all the flows instead of routing packets.
In addition to the raw CPU costs, there's also RAM cost. If your generating flows on a link that has a huge number of unique flows, it can easily start running out of RAM to keep track of all the connections.

Sampled Netflow "sflow"
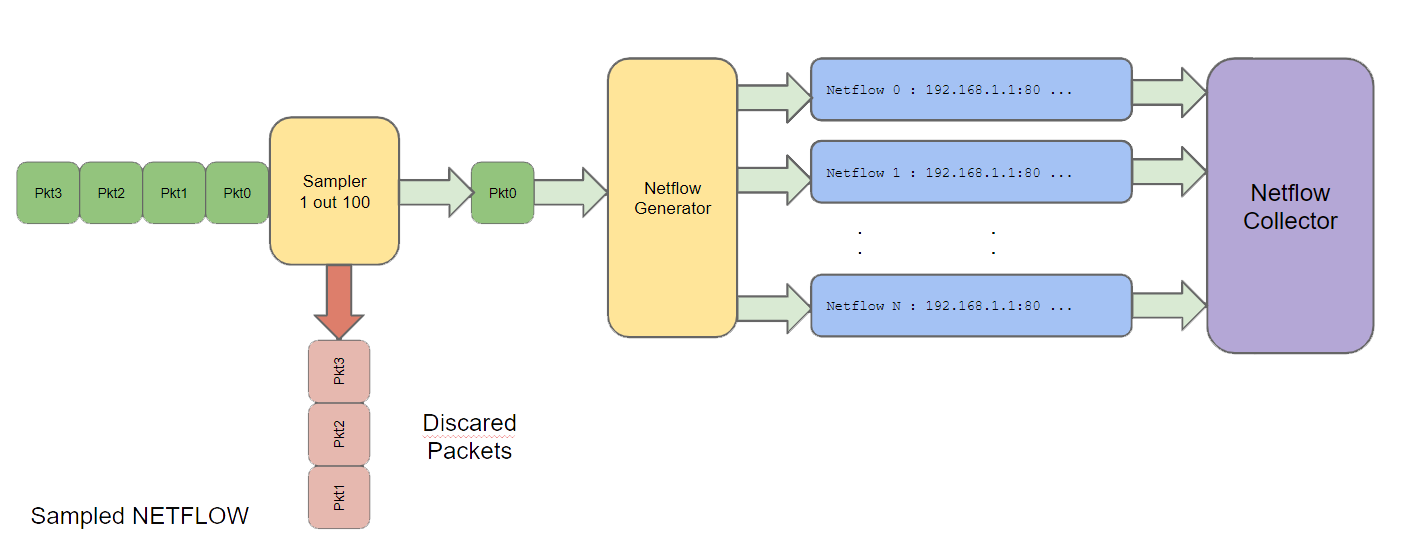
The solution to the above CPU and RAM performance issue is to "sample it", aka Sampled Netflow or sFlow. The idea is to say, sample 1 out of every 50 packets, e.g. discard 49 out of 50 packets. And because there are so many packets flying around on your network and if your looking for who's the biggest offender kind of questions, statistical sampling shows what those large flows are.
However if your looking for exact details, such as why is Host X connecting to a TOR node at 3am in the morning kind of question. Sampled netflows is a really bad option as you loose all the fine details of the traffic.
For example Sampled Netflow is completely useless for audit logs / attribution / security purposes because your not getting the full picture. Its not possible to 100% guarantee all TCP conversations were captured and logged, thus there is always that what-if X, what-if Y, ... question in the back of your mind.
In short Sampled Netflows can give you a good picture, its better than nothing but seriously lacks the detail NOC and SOC teams require.

Snapshot Netflow "snapflow"
One of the biggest problems with netflow information is, its unable to show precise bandwidth and circuit utilization information. This is because netflows are connection based, instead of time based. For example a single netflow of a 1 minute FTP connection shows a transfer of 10MB of data, over TCP between two hosts. Which is great you get visibility into where data was transferred. However there is no information of how it was transferred. Did 9MB complete in the first 5 seconds, and then trickled in for the remaining 55sec. Or was a consistent bandwidth for the full 60sec etc etc, there is no information on the data transfer rate details.
Enter Snapshot Netflows, the recommended approach on FMADIO 100G Packet Capture systems. Its full packet netflow generation (no loss), however the flows (not the packets) are output at regular intervals. This means you get full flow information, that also shows bandwidth profiles of each flow over time. For example using a netflow snapsnot at 100msec intervals, will output all the flows it finds within that 100msec interval, clear the flow log and start calculating flows again on the next packet.

Snapshot Visualization
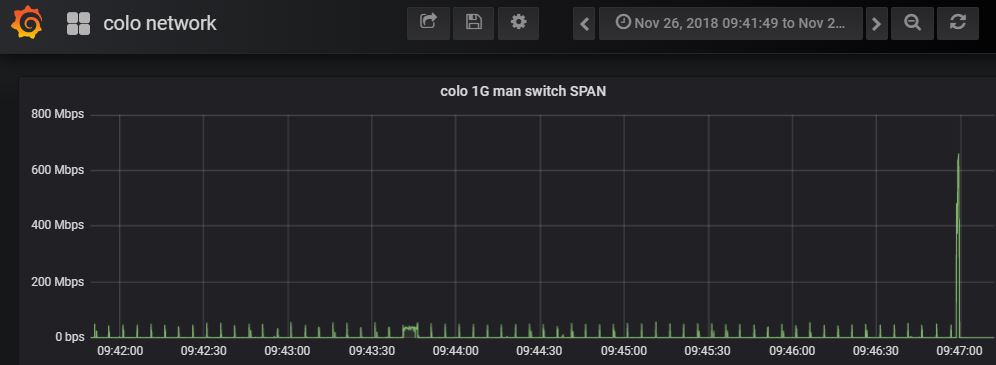
Netflow snapshots are great because you can filter on the backend after the fact. For example monitoring specific flows/circuit or investigate specific host or switch bandwidth issues on request. Because there is bandwidth and MAC/IP/Protocol/Port information at 100msec intervals, its trivial to monitor bandwidth on specific circuits or hosts. An example visualization is shown below.

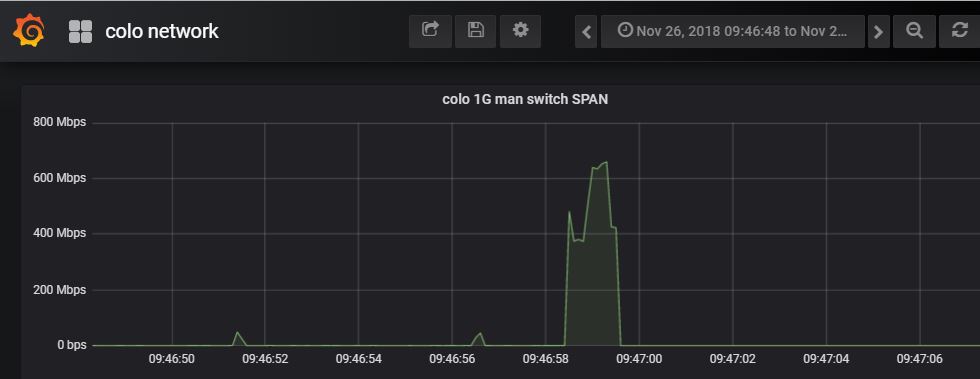
In the above case its very clear there's a number of small transfers followed by a large spike. Digging deeper, its possible to drill down even further to get a more accurate visualization and profile of the spike.

As to why the bandwidth profile looks like that its not clear, but... that's why you have full packet capture too! Now that you know when an unusual event occurred and an MAC/IP address range, using FMADIO 40G packet capture systems its easy to download a PCAP for that specific time range, IPs, ports and go deep using WireShark.
Scalable Monitoring Architecture
The other problem with traditional Netflows is the collector side. Typically netflow/IPFIX is output over UDP where the netflow collector scoops everything up. But there is no flow control, so the netflow collector can become overwhelmed, drop packets and netflows, generally causing pain all round. Its a problem because, those times you really want all netflows to be collected, is when there's a crazy spike in traffic that causes the netflow collector to drop data - its always the case...

The above diagram is a typical approach for collecting and analyzing netflow data. You`ll noticed the FIFOs on both the Generator and the collector, these are typically very small less than 1MB and in some cases only a few KB in size that is easy to overflow and drop data.
Netflow on ElasticStack
We take a different approach, and prefer using ElasticStack and Grafana for visualization/monitoring. They are both exceptionally good products and also free! Our approach is to use FMADIO SSD packet storage as a kind of FIFO, where both the ingress and egress of the netflow generator (pcap2json) has full flow control. The result is full and complete coverage, zero loss. The logical flow looks like the following.

The primary difference is the massive 1TB~100TB (yes TeraBytes) "SSD Packet Cache", a more traditional name would be packet capture storage. However FMADIO 10G 40G 100G Packet Capture systems are more than your typical packet capture systems. In this case the packet capture system is running our OpenSource pcap2json utility to convert that massive SSD Packet Cache FIFO into netflow snapshots.
The key point is netflow generation runs post capture, meaning every single packet captured gets processed by the netflow generator without hard realtime deadlines. So the generator can take as much or as little time as it wants, by buffering packets in the massive TB`s sized FIFO.
The netflow egress side is where many performance problems occur. Typically a Netflow Collector or in this case ElasticStack is likely the bottleneck. The key difference between a netflow collector and ElasticStack is, ElasticStack inserts are over TCP HTTP JSON requests (not lossy UDP), resulting in full flow control and ZERO netflows dropped, period.
If ElasticStack stalls and results in the generator having to throttle and slow down, its no problem because of the 1TB~100TB of buffering. This approach results in processing every single packet, generating every single netflow snapshot, full and complete coverage.
Final Thoughts
Don't think of packet capture as a PCAP on simple magnetic storage. True in the past, but with high speed SSD drives so many things can be achieved now. Netflow Snapshot generation is a nice example of using FMADIO 100G Packet Capture systems to buffer, process and send processed data downstream for further processing.
Best still, you have full packet capture to fall back on for those hard to find deep dive investigations!


